

Question: Given the table below summarizing data from a series of consolidated undrained triaxial compression test on sand. This series of tests were conducted on four
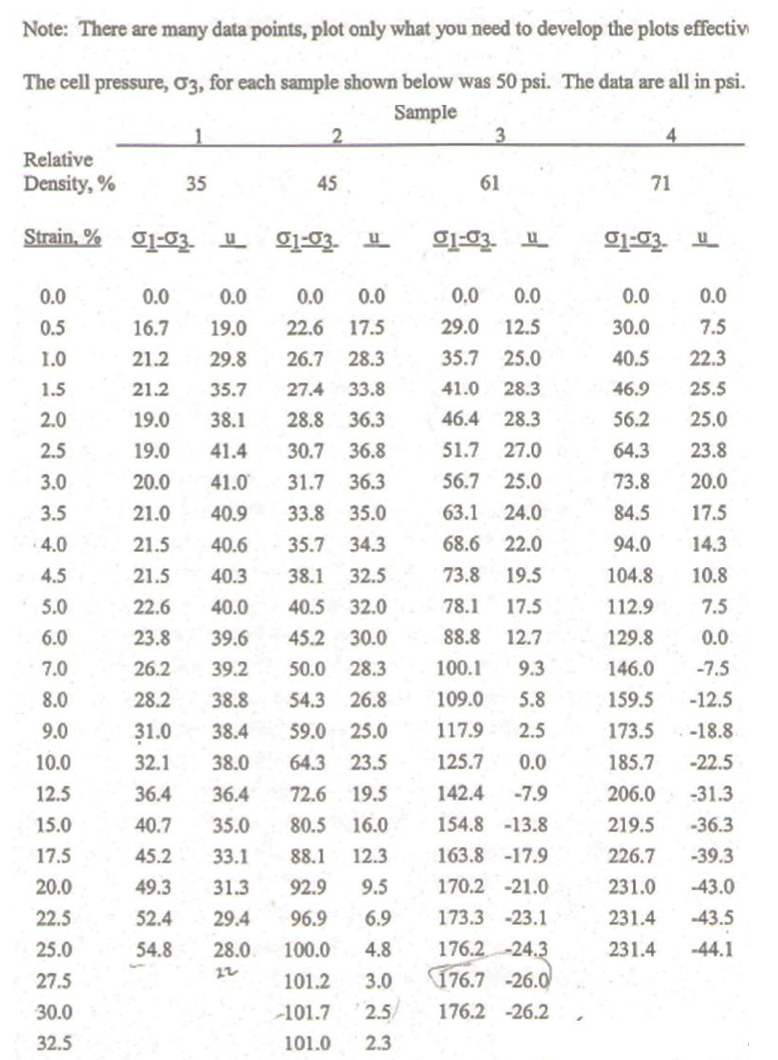
Given the table below summarizing data from a series of consolidated undrained triaxial compression test on sand. This series of tests were conducted on four samples with different relative densities but at the same confining pressure of psi. The provided data include measured axial strain, deviatoric stress during axial loading, and excess pore pressure during axial loading. a Plot the deviatoric stress vs strain curves for each sample. Plot all on the same Figure; b Plot the pore pressure vs strain for each sample. Plot all on the same Figure; c Plot values of effective principal stress ratio sigma sigma vs axial strain. Plot all on the same Figure; d Draw the effective and total Mohr circles at failure, total stress circles on one graph and effective stress circles on another graph; e Plot the total and effective stress paths for all samples using MIT method. Plot stress paths for each sample on a separate figure. On this plot of stress paths for each sample, show the Kf and Kf lines. did you observe any differences in theses effective stress paths?
Step by Step Solution
There are 3 Steps involved in it
1 Expert Approved Answer
Step: 1 Unlock

Question Has Been Solved by an Expert!
Get step-by-step solutions from verified subject matter experts
Step: 2 Unlock
Step: 3 Unlock