

Question: Given the test setup shown below, a . Develop a plot of elevation ( vertical axis ) versus head ( horizontal axis ) with the
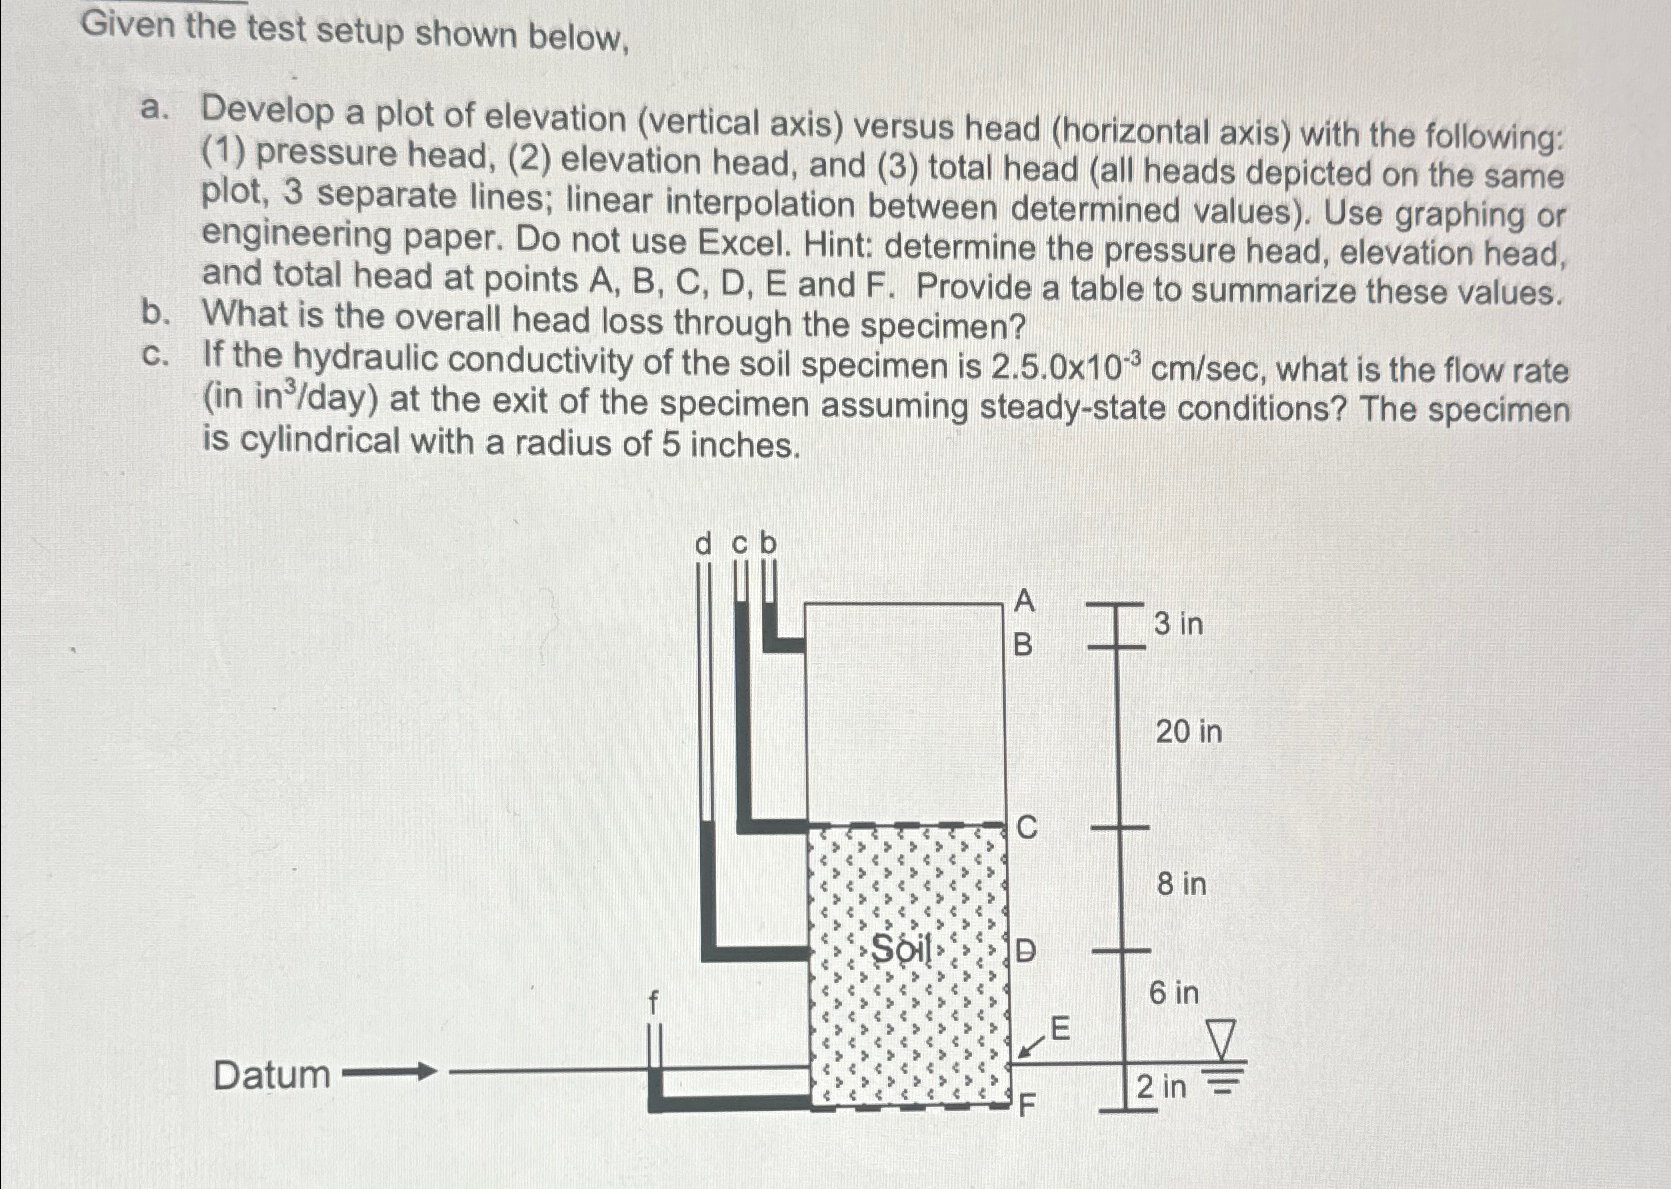
Given the test setup shown below,
a Develop a plot of elevation vertical axis versus head horizontal axis with the following: pressure head, elevation head, and total head all heads depicted on the same plot, separate lines; linear interpolation between determined values Use graphing or engineering paper. Do not use Excel. Hint: determine the pressure head, elevation head, and total head at points A B C D E and F Provide a table to summarize these values.
b What is the overall head loss through the specimen?
c If the hydraulic conductivity of the soil specimen is what is the flow rate in in day at the exit of the specimen assuming steadystate conditions? The specimen is cylindrical with a radius of inches.
Datum longrightarrowlongrightarrow
Step by Step Solution
There are 3 Steps involved in it
1 Expert Approved Answer
Step: 1 Unlock

Question Has Been Solved by an Expert!
Get step-by-step solutions from verified subject matter experts
Step: 2 Unlock
Step: 3 Unlock