

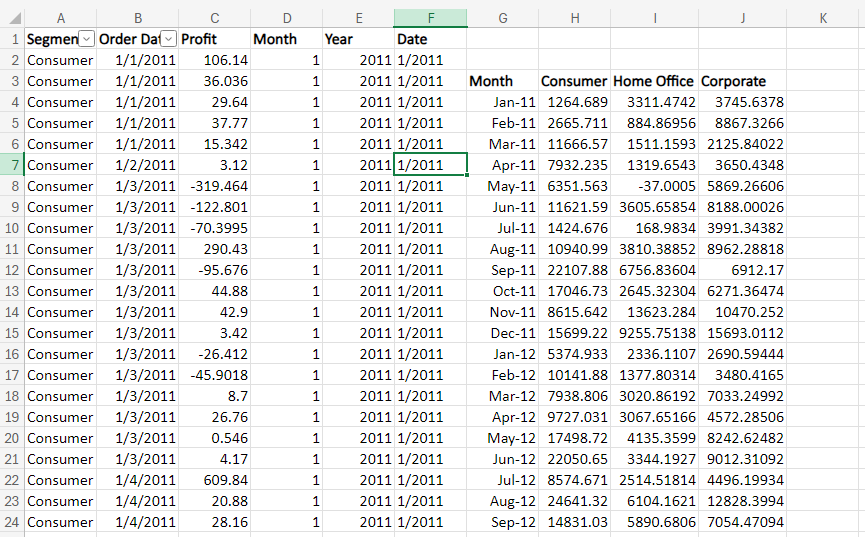
Question: Given this data In excel how would I make the following: Bubble chart: Annual profit for each segment. Give me the im clearly missing somthing
Given this data In excel how would I make the following: Bubble chart: Annual profit for each segment. Give me the im clearly missing somthing because I cant just highlight All the data and do it You also cant see the other lines of excel. Again I don't need you to do it for me just how to do it and why it is not working. Thank you!
Step by Step Solution
There are 3 Steps involved in it
1 Expert Approved Answer
Step: 1 Unlock

Question Has Been Solved by an Expert!
Get step-by-step solutions from verified subject matter experts
Step: 2 Unlock
Step: 3 Unlock