

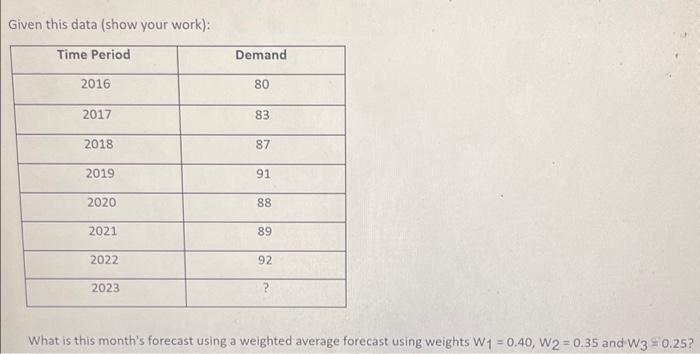
Question: Given this data (show your work): Time Period 2016 2017 2018 2019 2020 2021 2022 2023 Demand 80 83 87 91 88 89 92 ?
Given this data (show your work): Time Period 2016 2017 2018 2019 2020 2021 2022 2023 Demand 80 83 87 91 88 89 92 ? What is this month's forecast using a weighted average forecast using weights W1 = 0.40, W2 = 0.35 and W3 = 0.25?
Given this data (show your work): What is this month's forecast using a weighted average forecast using weights W1=0.40,W2=0.35 and W3=0.25 ? Given this data (show your work): What is this month's forecast using a weighted average forecast using weights W1=0.40,W2=0.35 and W3=0.25
Step by Step Solution
There are 3 Steps involved in it
1 Expert Approved Answer
Step: 1 Unlock

Question Has Been Solved by an Expert!
Get step-by-step solutions from verified subject matter experts
Step: 2 Unlock
Step: 3 Unlock