

Question: Given this frequency distribution, what demand values would be associated with the following random numbers? Note: Do not round intermediate calculations. Demand. 0 WNTO
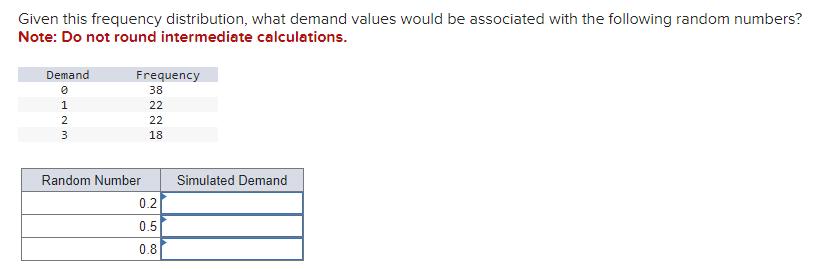
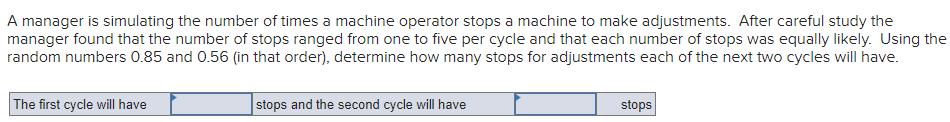
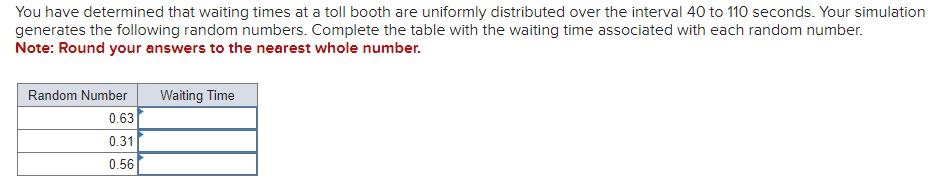
Given this frequency distribution, what demand values would be associated with the following random numbers? Note: Do not round intermediate calculations. Demand. 0 WNTO 1 2 3 Frequency 38 22 22 18. Random Number 0.2 0.5 0.8 Simulated Demand A manager is simulating the number of times a machine operator stops a machine to make adjustments. After careful study the manager found that the number of stops ranged from one to five per cycle and that each number of stops was equally likely. Using the random numbers 0.85 and 0.56 (in that order), determine how many stops for adjustments each of the next two cycles will have. The first cycle will have stops and the second cycle will have stops You have determined that waiting times at a toll booth are uniformly distributed over the interval 40 to 110 seconds. Your simulation generates the following random numbers. Complete the table with the waiting time associated with each random number. Note: Round your answers to the nearest whole number. Random Number 0.63 0.31 0.56 Waiting Time
Step by Step Solution
3.38 Rating (157 Votes )
There are 3 Steps involved in it
Simulated Demand answer To determine the simulated demand and the waiting we can use the provided information in the following tables Frequency distri... View full answer

Get step-by-step solutions from verified subject matter experts