

Question: Given two CSV files containing data for Broadway shows' Capacity ( percentage of the theatre filled ) and Gross Potential ( maximum amount that can
Given two CSV files containing data for Broadway shows' Capacity percentage of the theatre filled and Gross Potential maximum amount that can be earned for multiple shows in a specific month:
Read in each CSV file as dataframes.
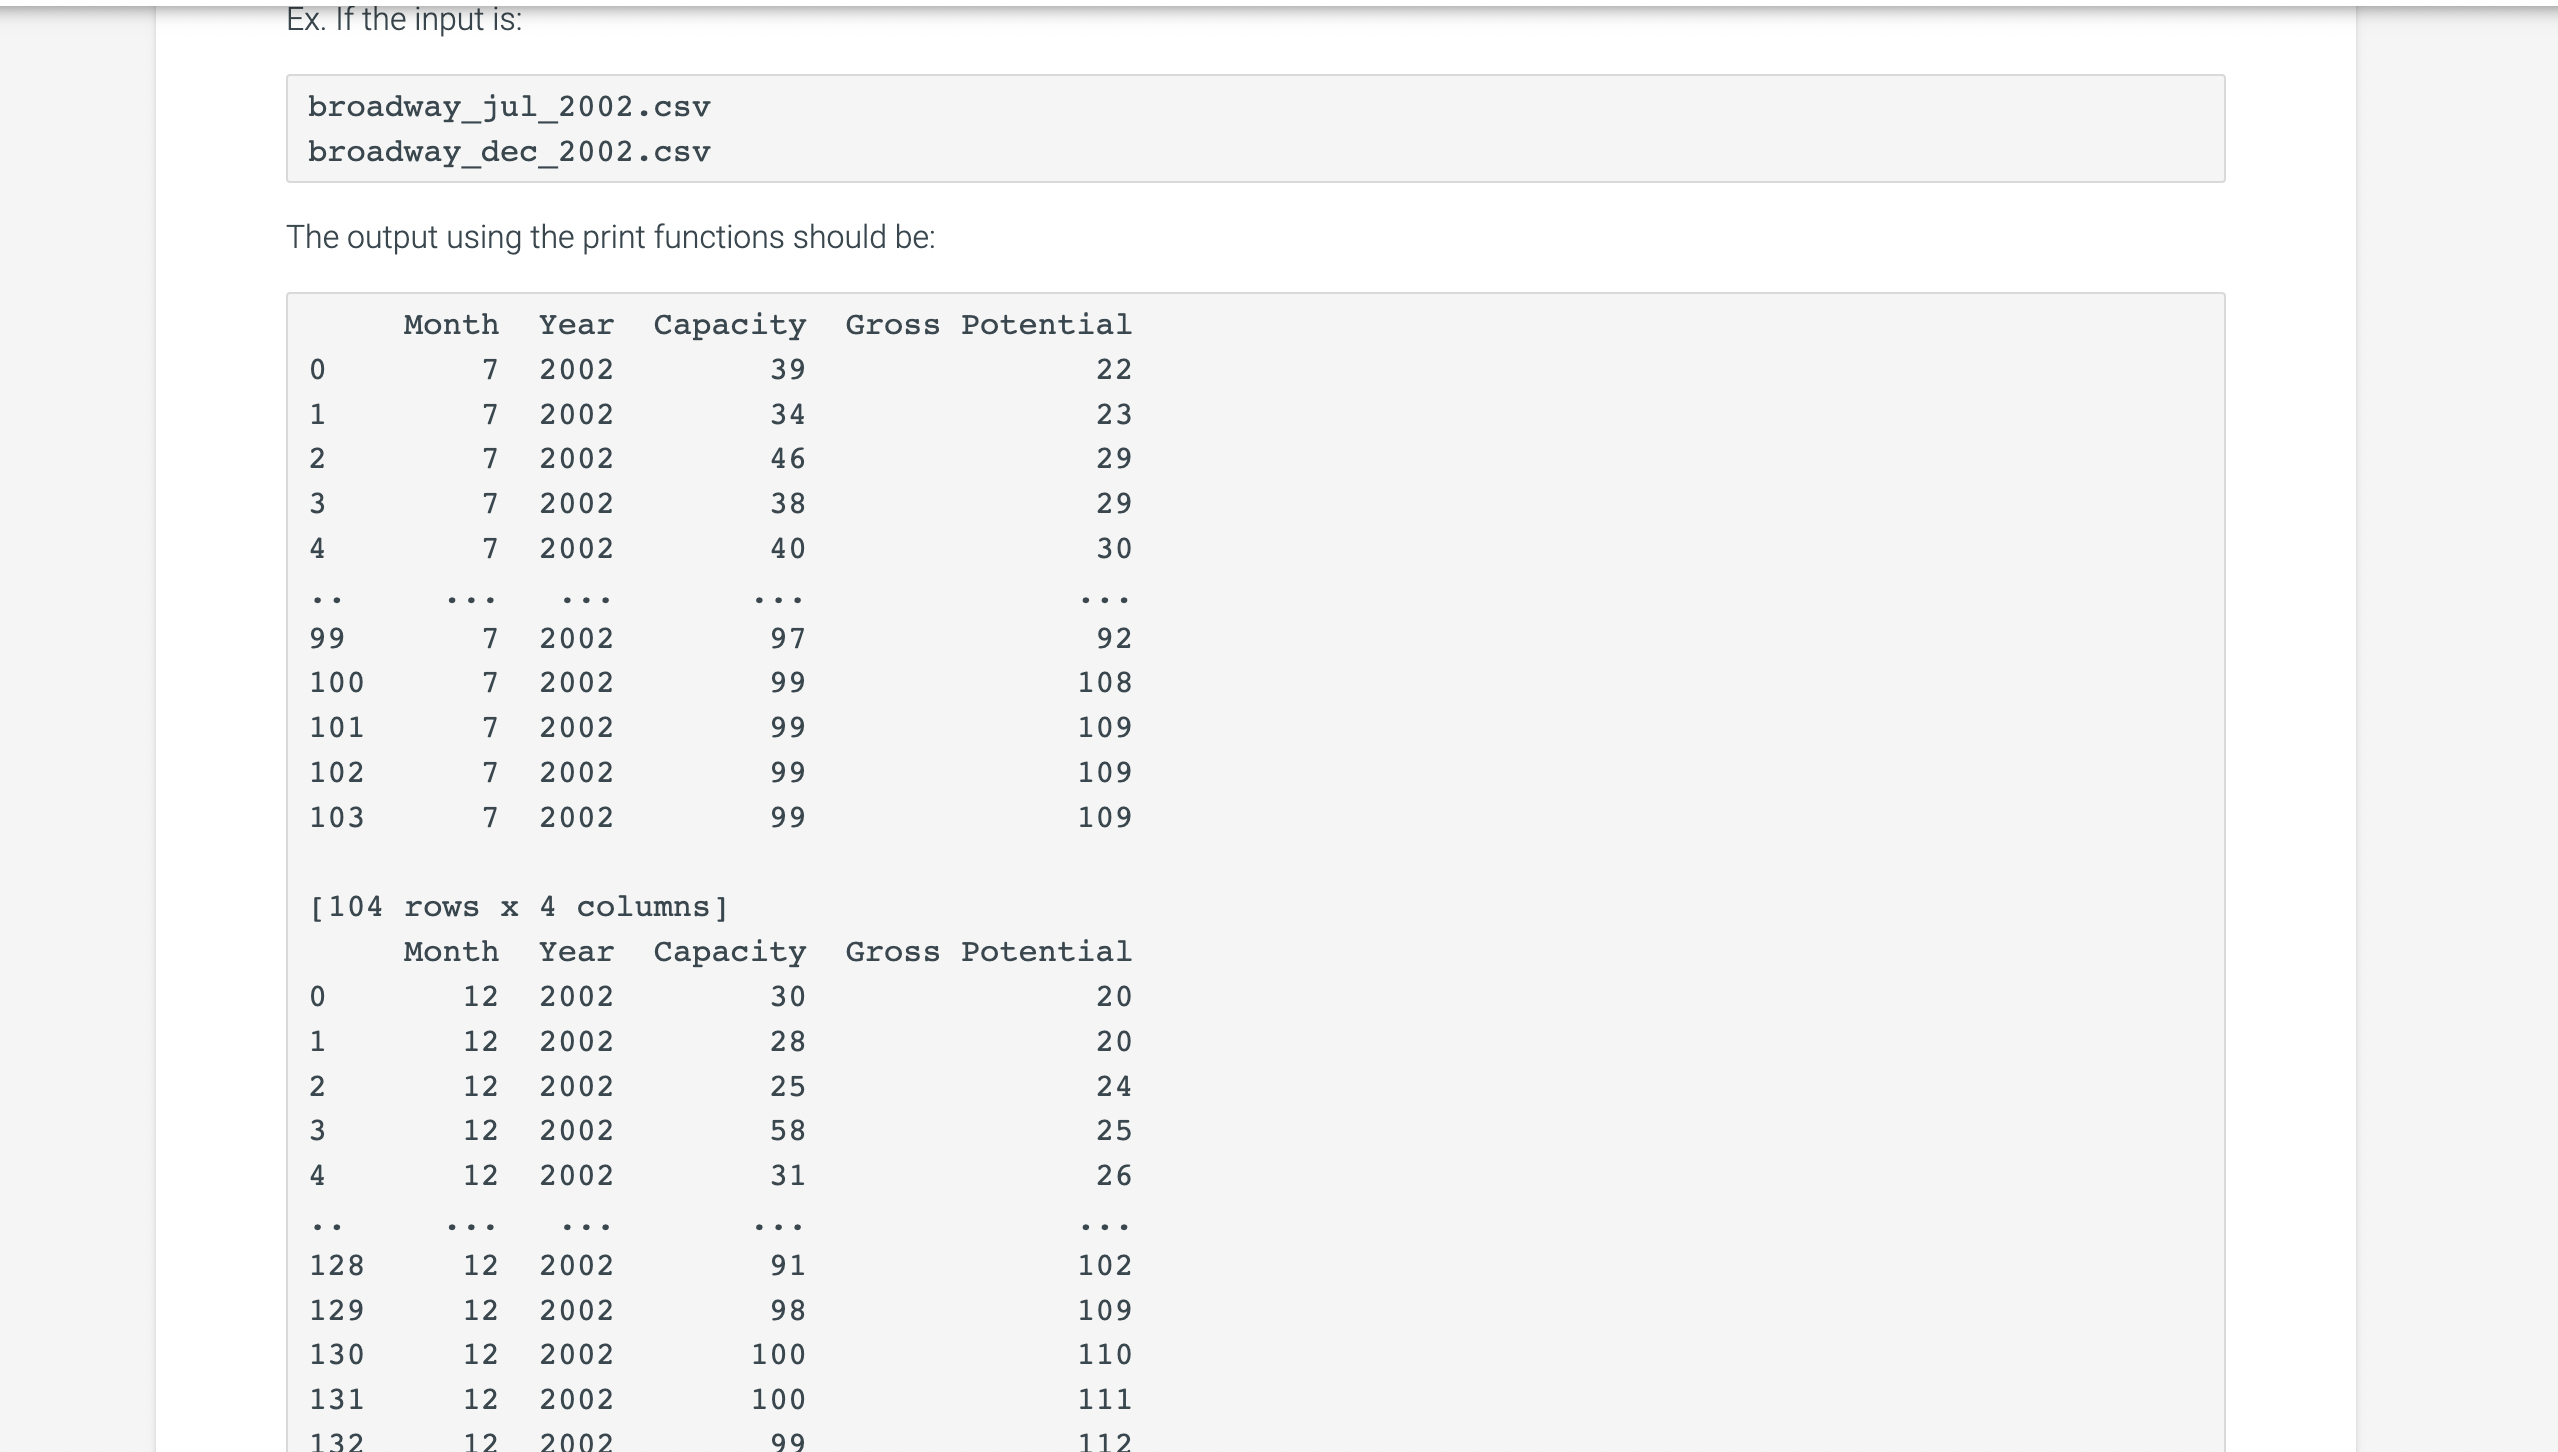
Print each dataframe individually with a separate print function, one print function per dataframe.
Generate an image containing two scatter subplots comparing that month's Capacity and Gross Potential.
The main title of the image should be "Capacity vs Gross Potential", with each subplot's title being the month and year, respectively ie "July
The left subplot should be July's, with the right subplot being December's.
The xaxis should be "Gross Potential" with the yaxis being "Capacity".Ex If the input is:
broadwayjulcsv
broadwaydeccsv
The output using the print functions should be:
Step by Step Solution
There are 3 Steps involved in it
1 Expert Approved Answer
Step: 1 Unlock

Question Has Been Solved by an Expert!
Get step-by-step solutions from verified subject matter experts
Step: 2 Unlock
Step: 3 Unlock