

Question: Given two data sets, apply the hypothesis testing as a pararmetric analysis technique; Given two data sets, apply hypothesis testing as a parametric analysis technique
Given two data sets, apply the hypothesis testing as a pararmetric analysis technique;
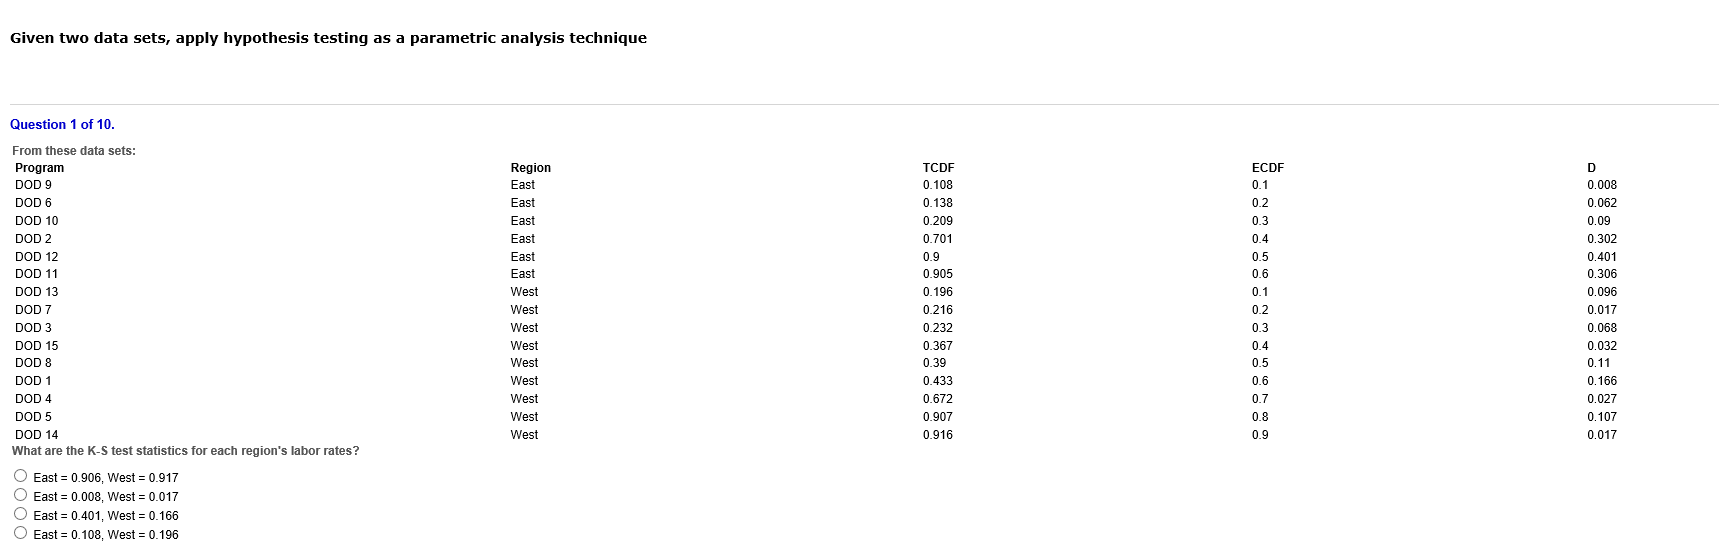
Given two data sets, apply hypothesis testing as a parametric analysis technique Question 1 of 10. From these data sets: ECDF D Region TCDF Program 0. 108 0.1 0.008 DOD 9 East East 0.138 0.2 0.062 DOD 6 East 0.209 0.3 0.09 DOD 10 0.302 DOD 2 East 0.701 0.4 DOD 12 East 0.9 0.5 0.401 East 0.905 0.6 0.306 DOD 11 West 0. 196 0.1 0.096 DOD 13 West 0.216 0.2 0.017 DOD 7 0.232 0.3 0.068 DOD 3 West West 0.367 0.4 0.032 DOD 15 0.39 0.5 0.11 DOD 8 West West 0.433 0.6 0.166 DOD 1 0.7 0.027 DOD 4 West 0.672 0.907 0.8 0.107 DOD 5 West West 0.916 09 0.017 DOD 14 What are the K-S test statistics for each region's labor rates? East = 0.906, West = 0.917 East = 0.008, West = 0.017 O East = 0.401, West = 0.166 East = 0.108, West = 0.196
Step by Step Solution
There are 3 Steps involved in it

Get step-by-step solutions from verified subject matter experts