

Question: Giving the following DATA (USING EXCEL) Date A B C D index 3-Jan-16 84.87 14.05 67.55 41.7 6,517.71 10-Jan-16 67.02 12.25 57.84 37.4 6,038.03 17-Jan-16
Giving the following DATA (USING EXCEL)
| Date | A | B | C | D | index |
| 3-Jan-16 | 84.87 | 14.05 | 67.55 | 41.7 | 6,517.71 |
| 10-Jan-16 | 67.02 | 12.25 | 57.84 | 37.4 | 6,038.03 |
| 17-Jan-16 | 54.05 | 9.7 | 45.8 | 34 | 5,459.84 |
| 24-Jan-16 | 59.93 | 10.35 | 47.07 | 38.6 | 5,698.56 |
| 31-Jan-16 | 66.53 | 11.4 | 55.09 | 41.1 | 5,927.36 |
| 7-Feb-16 | 64.82 | 11.65 | 52.35 | 42.5 | 5,832.92 |
| 14-Feb-16 | 62.13 | 11.2 | 39.89 | 41 | 5,801.65 |
| 21-Feb-16 | 66.28 | 11.3 | 40.74 | 41.8 | 5,942.28 |
| 28-Feb-16 | 68.24 | 11.95 | 42 | 42.8 | 6,170.16 |
| 6-Mar-16 | 67.51 | 12.35 | 47.07 | 44.5 | 6,370.37 |
| 13-Mar-16 | 76.07 | 12.8 | 49.39 | 44 | 6,305.78 |
| 20-Mar-16 | 72.15 | 13.35 | 49.18 | 43 | 6,460.98 |
| 27-Mar-16 | 68 | 13.25 | 50.66 | 41 | 6,215.65 |
| 3-Apr-16 | 64.33 | 13.9 | 43.27 | 41.8 | 6,213.58 |
| 10-Apr-16 | 66.04 | 14.5 | 47.7 | 44.5 | 6,442.04 |
| 17-Apr-16 | 66.77 | 14.95 | 47.07 | 47.5 | 6,512.43 |
| 24-Apr-16 | 69.95 | 15.05 | 53.61 | 49.1 | 6,820.30 |
| 1-May-16 | 67.26 | 14 | 57.84 | 48 | 6,586.50 |
| 8-May-16 | 71.18 | 13.55 | 61.64 | 50.5 | 6,654.20 |
| 15-May-16 | 68.97 | 14.2 | 58.68 | 51 | 6,737.40 |
QUESTIONS
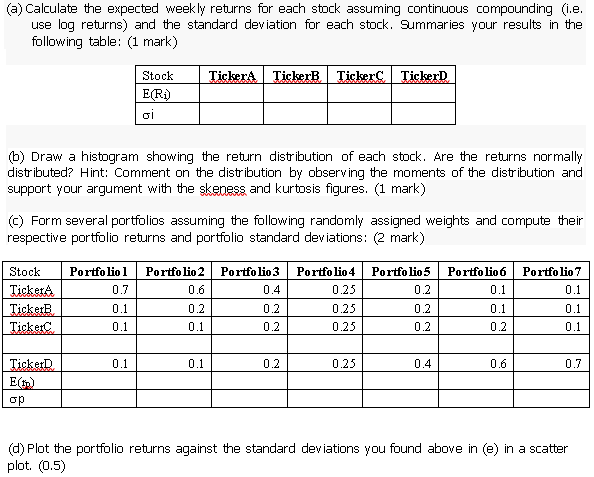
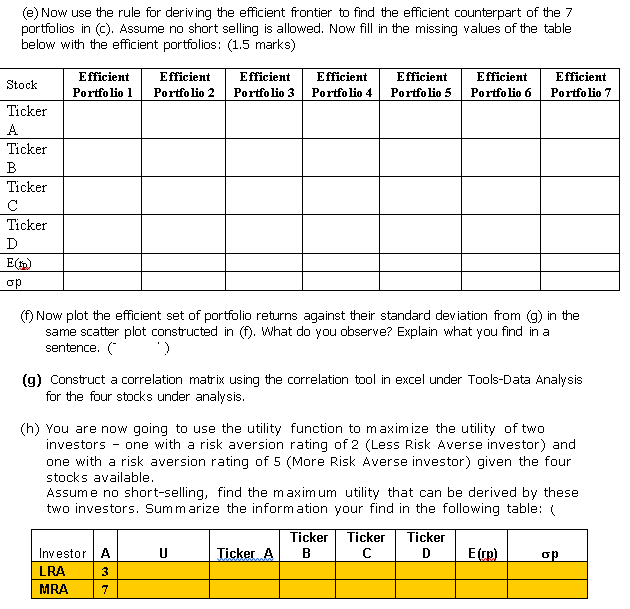
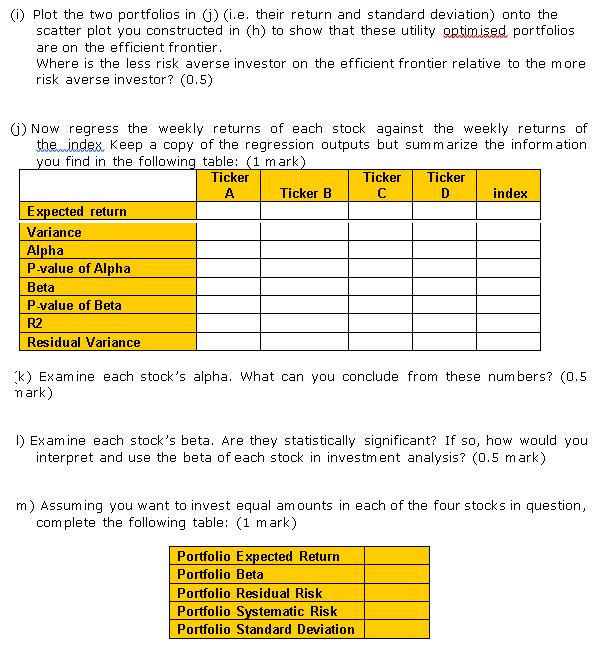
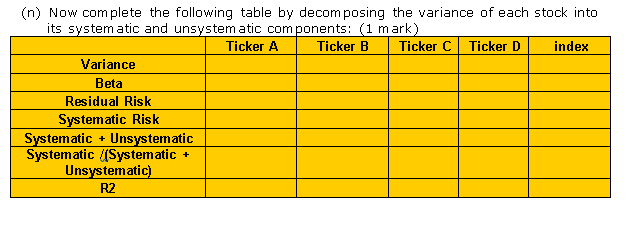
(a) Calculate the expected weekly returns for each stock assuming continuous compounding (i.e. use log returns) and the standard deviation for each stock. Summaries your results in the following table: (1 mark) Ticker Ticker Ticker TickerD Stock E(R) gi 6) Draw a histogram showing the return distribution of each stock. Are the returns normally distributed? Hint: Comment on the distribution by observing the moments of the distribution and support your argument with the skeness and kurtosis figures. (1 mark) (c) Form several portfolios assuming the following randomly assigned weights and compute their respective portfolio returns and portfolio standard deviations: (2 mark) Portfolio 1 0.7 Portfolio 3 0.4 Portfolio 4 0.25 Portfolio 7 0.1 Stock Ticker TickerB Ticketc Portfolio 2 0.6 0.2 0.1 Portfolio 5 0.2 0.2 0.2 Portfolio 6 0.1 0.1 0.2 0.1 0.2 0.1 0.25 0.25 0.1 0.2 0.1 0.1 0.1 0.2 0.25 0.4 0.6 0.7 TickerD E() op (d) Plot the portfolio returns against the standard deviations you found above in (e) in a scatter plot (0.5) (e) Now use the rule for deriving the efficient frontier to find the efficient counterpart of the 7 portfolios in (c). Assume no short selling is allowed. Now fill in the missing values of the table below with the efficient portfolios: (1.5 marks) Stock Efficient Portfolio 1 Efficient Portfolio 2 Efficient Portfolio 3 Efficient Portfolio 4 Efficient Portfolio 5 Efficient Portfolio 6 Efficient Portfolio 7 Ticker A Ticker B Ticker Ticker D E(ID) op (f) Now plot the efficient set of portfolio returns against their standard deviation from (g) in the same scatter plot constructed in (f). What do you observe? Explain what you find in a sentence. ) (g) Construct a correlation matrix using the correlation tool in excel under Tools-Data Analysis for the four stocks under analysis. (h) You are now going to use the utility function to maximize the utility of two investors - one with a risk aversion rating of 2 (Less Risk Averse investor) and one with a risk aversion rating of 5 (More Risk Averse investor) given the four stocks available. Assume no short-selling, find the maximum utility that can be derived by these two investors. Summarize the information your find in the following table:( Ticker Ticker Ticker Investor A U Ticker A B D EU) op LRA 3 MRA 7 (1) Plot the two portfolios in () (.e. their return and standard deviation) onto the scatter plot you constructed in (h) to show that these utility optimised portfolios are on the efficient frontier Where is the less risk averse investor on the efficient frontier relative to the more risk averse investor? (0.5) () Now regress the weekly returns of each stock against the weekly returns of the mindex Keep a copy of the regression outputs but summarize the information you find in the following table: (1 mark) Ticker Ticker Ticker A Ticker B D index Expected return Variance Alpha P-value of Alpha Beta P-value of Beta R2 Residual Variance K) Examine each stock's alpha. What can you conclude from these numbers? (0.5 nark) 1) Examine each stock's beta. Are they statistically significant? If so, how would you interpret and use the beta of each stock in investment analysis? (0.5 mark) m) Assuming you want to invest equal amounts in each of the four stocks in question, complete the following table: (1 mark) Portfolio Expected Return Portfolio Beta Portfolio Residual Risk Portfolio Systematic Risk Portfolio Standard Deviation (n) Now complete the following table by decomposing the variance of each stock into its system atic and unsystem atic components: (1 mark) Ticker A Ticker B Ticker C Ticker D index Variance Beta Residual Risk Systematic Risk Systematic + Unsystematic Systematic /(Systematic + Unsystematic) R2 (a) Calculate the expected weekly returns for each stock assuming continuous compounding (i.e. use log returns) and the standard deviation for each stock. Summaries your results in the following table: (1 mark) Ticker Ticker Ticker TickerD Stock E(R) gi 6) Draw a histogram showing the return distribution of each stock. Are the returns normally distributed? Hint: Comment on the distribution by observing the moments of the distribution and support your argument with the skeness and kurtosis figures. (1 mark) (c) Form several portfolios assuming the following randomly assigned weights and compute their respective portfolio returns and portfolio standard deviations: (2 mark) Portfolio 1 0.7 Portfolio 3 0.4 Portfolio 4 0.25 Portfolio 7 0.1 Stock Ticker TickerB Ticketc Portfolio 2 0.6 0.2 0.1 Portfolio 5 0.2 0.2 0.2 Portfolio 6 0.1 0.1 0.2 0.1 0.2 0.1 0.25 0.25 0.1 0.2 0.1 0.1 0.1 0.2 0.25 0.4 0.6 0.7 TickerD E() op (d) Plot the portfolio returns against the standard deviations you found above in (e) in a scatter plot (0.5) (e) Now use the rule for deriving the efficient frontier to find the efficient counterpart of the 7 portfolios in (c). Assume no short selling is allowed. Now fill in the missing values of the table below with the efficient portfolios: (1.5 marks) Stock Efficient Portfolio 1 Efficient Portfolio 2 Efficient Portfolio 3 Efficient Portfolio 4 Efficient Portfolio 5 Efficient Portfolio 6 Efficient Portfolio 7 Ticker A Ticker B Ticker Ticker D E(ID) op (f) Now plot the efficient set of portfolio returns against their standard deviation from (g) in the same scatter plot constructed in (f). What do you observe? Explain what you find in a sentence. ) (g) Construct a correlation matrix using the correlation tool in excel under Tools-Data Analysis for the four stocks under analysis. (h) You are now going to use the utility function to maximize the utility of two investors - one with a risk aversion rating of 2 (Less Risk Averse investor) and one with a risk aversion rating of 5 (More Risk Averse investor) given the four stocks available. Assume no short-selling, find the maximum utility that can be derived by these two investors. Summarize the information your find in the following table:( Ticker Ticker Ticker Investor A U Ticker A B D EU) op LRA 3 MRA 7 (1) Plot the two portfolios in () (.e. their return and standard deviation) onto the scatter plot you constructed in (h) to show that these utility optimised portfolios are on the efficient frontier Where is the less risk averse investor on the efficient frontier relative to the more risk averse investor? (0.5) () Now regress the weekly returns of each stock against the weekly returns of the mindex Keep a copy of the regression outputs but summarize the information you find in the following table: (1 mark) Ticker Ticker Ticker A Ticker B D index Expected return Variance Alpha P-value of Alpha Beta P-value of Beta R2 Residual Variance K) Examine each stock's alpha. What can you conclude from these numbers? (0.5 nark) 1) Examine each stock's beta. Are they statistically significant? If so, how would you interpret and use the beta of each stock in investment analysis? (0.5 mark) m) Assuming you want to invest equal amounts in each of the four stocks in question, complete the following table: (1 mark) Portfolio Expected Return Portfolio Beta Portfolio Residual Risk Portfolio Systematic Risk Portfolio Standard Deviation (n) Now complete the following table by decomposing the variance of each stock into its system atic and unsystem atic components: (1 mark) Ticker A Ticker B Ticker C Ticker D index Variance Beta Residual Risk Systematic Risk Systematic + Unsystematic Systematic /(Systematic + Unsystematic) R2
Step by Step Solution
There are 3 Steps involved in it

Get step-by-step solutions from verified subject matter experts