Question: GM'B Capital Allocation Framework 2184136 GM had started paying a quarterly dividend of $0.30 per share in the first quarter of 2014, and it armounced
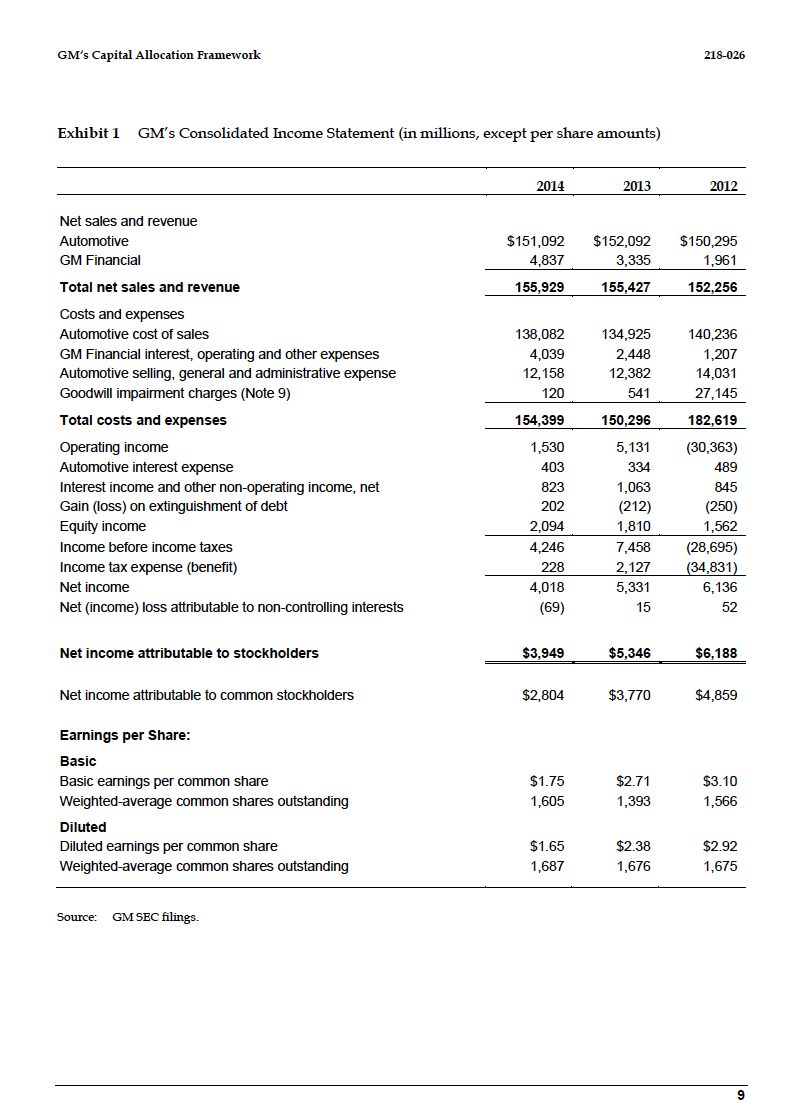
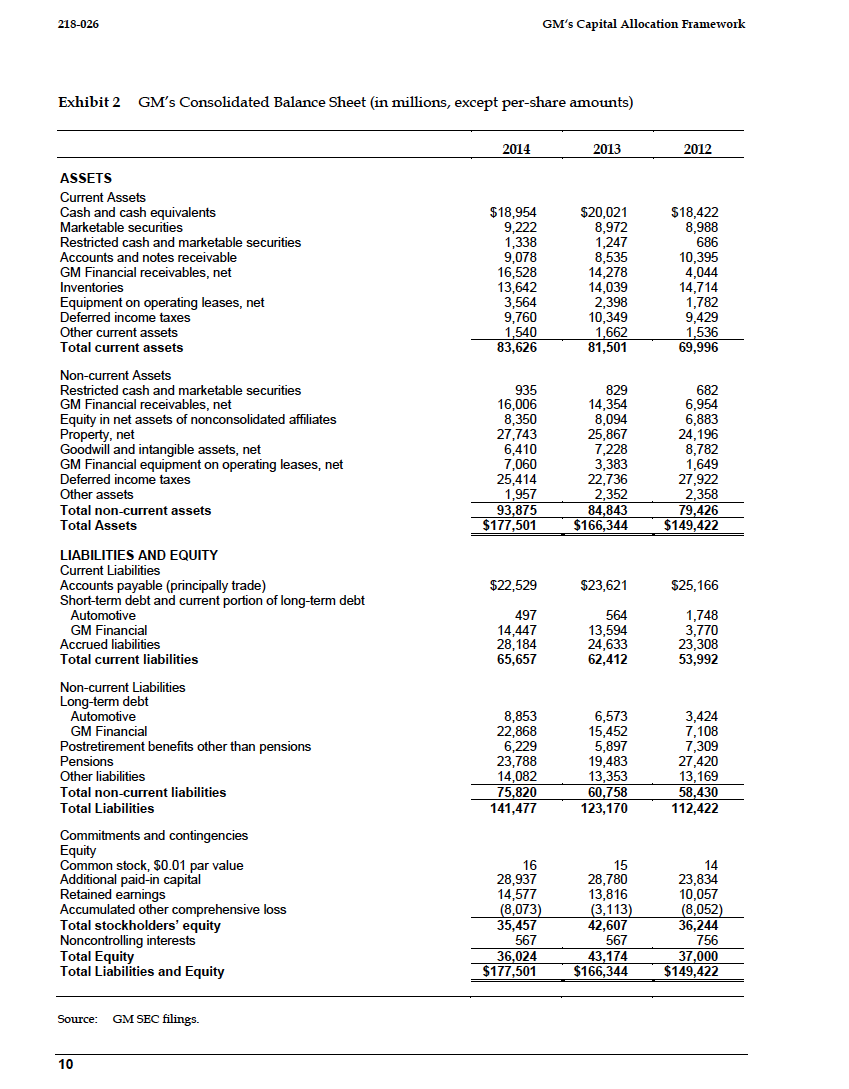
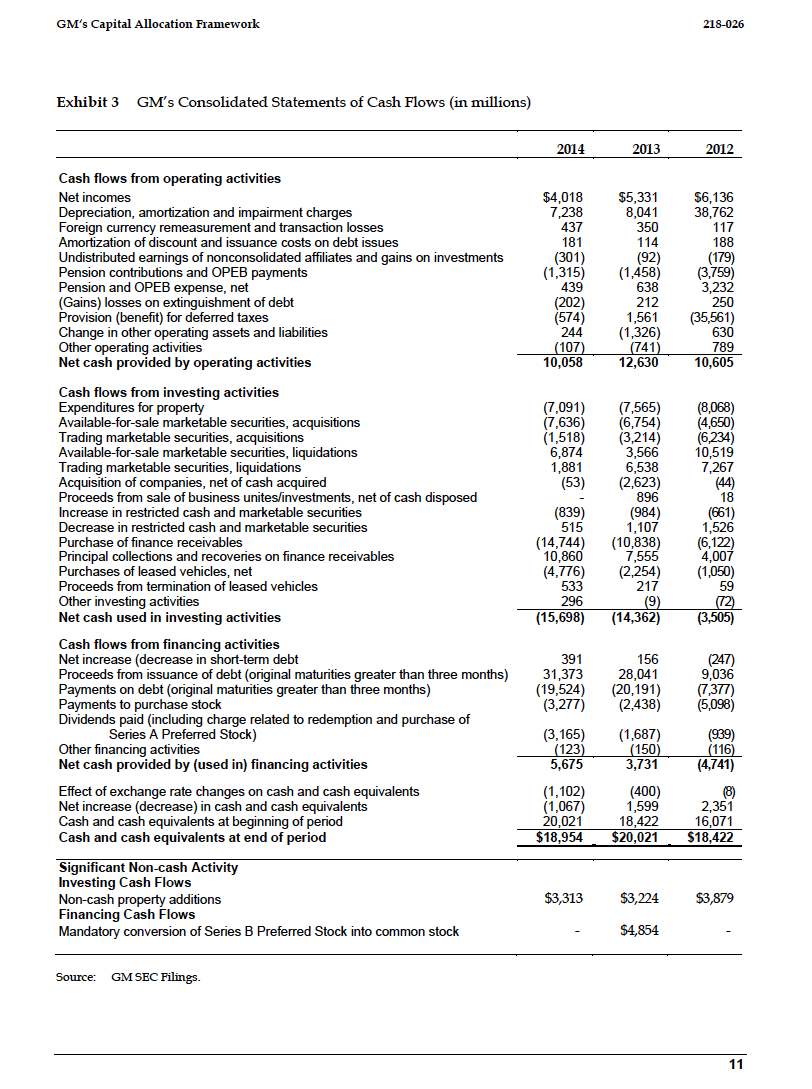
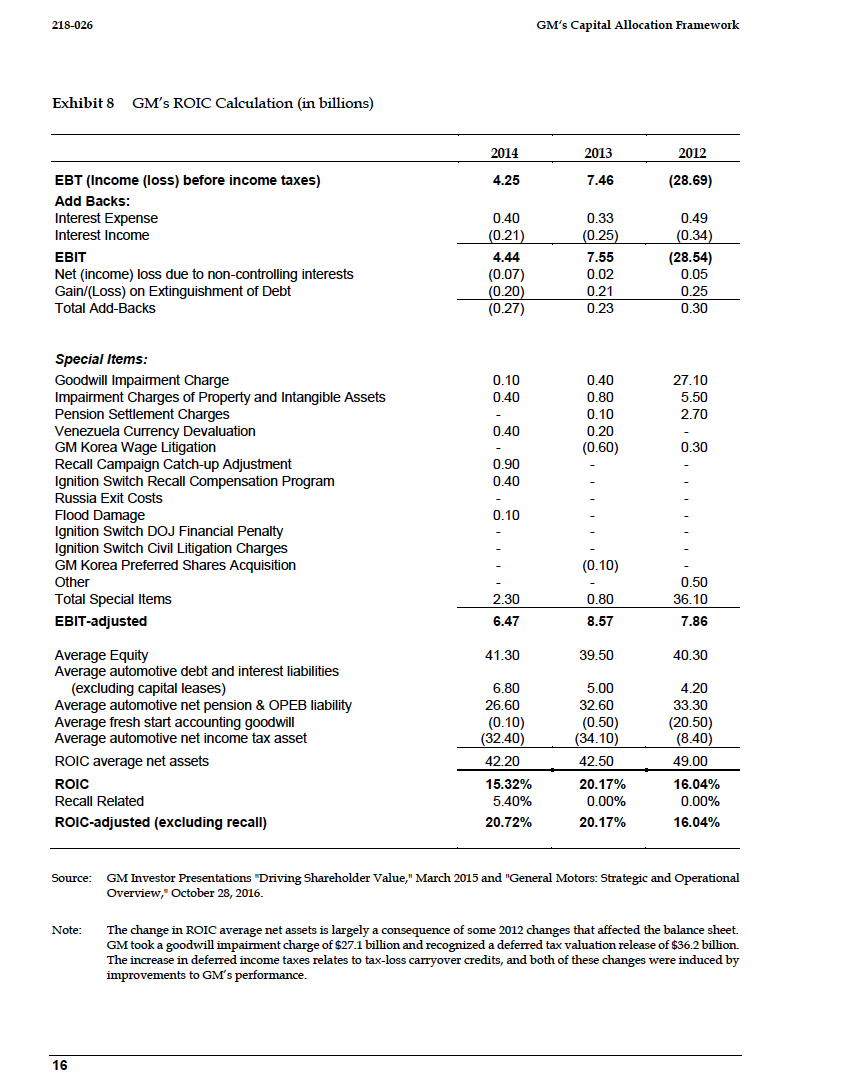
GM'B Capital Allocation Framework 2184136 GM had started paying a quarterly dividend of $0.30 per share in the first quarter of 2014, and it armounced plans to increase the dividend to $0.36 per share beginning in the second quarter of 2015.31 At the time the capital allocation framework was announced, the Board of Directors authorized a repurchase of $5 billion in GM shares that would begin inunediately and conclude before the end of 2916. hiany praised the capital allocation framework following its armouncenrent. For example, a JP. Morgan analyst wrote, \"There was much for investors to like in yesterday's press release and analyst conference call, including four incremental takeaways: (1] GM is returning more capital to shareholders, sooner than expected (the buyback is being implemented immediately, vs. IPM 1Q'16]; (2) GM will be returning more capital to shareholders on an ongoing basis {it targets the return of all available free cash ow); [3) GM targets a more efficient capital structure {now encompassing $211] bn of gross automotive cash vs. $20$25 bn prior, with consequent benefit to nancial returns); and {4) GM is increasing transparency with respect to nearterm targets (it benchmarks a 20% RDIC, for which it will share its managerial calculation each Iquarter}."'5"t2 Exhibit 1!! includes information about analyst projections for GM. Related GM Management Processes Putting the capital allocation tranlework into practice required incorporating its tenets into several GM management practices. It had direct implications for two in particular, namely the capital budgeting process and the incentive compensation system Capital Budgeting: GM's main capital budgeting process allocated around $3 to $9 billion in capital expenditures and $7 billion in spending on engineering that was classied as research and development (RSID). These funds were prin'Larily directed towards product programs. For each prograsm, market facing managers held responsibility for determining what customers wanted and making revenue commitments. Chief product engineers weighed customer demands with other design issues and worked to develop a product program business case with the product program finance tearrl. This business case included projected volumes, prices, and material costs over the life of the product program It was typically easier to formulate projections when working on an update to or replacement of an existing program as opposed to a new program. While there tended to be an appetite to engage in more product launches, the risk of excessive optimism on volume or pricing was significant for new products. Analysis also yielded estimates of how much capital would be deployed in a product program. These projections were used to compute measures of ROIC over the life of a product program and to determine if average ROIC exceeded the 20% target. The performance of product programs was evaluated and monitored at many points in time. A business case had to pass through many gates and checks before production started. Once a product program started, inflight performance was tracked and compared to the commitments that had been made. The performance of product programs was also carefully studied after the program concluded. There was regular reporting of results among managers and to the Board of Directors. Recent efforts had enhanced GIvI's ability to consider product programs in a more integrated way. The Vehicle Execution Group, led by Mark Reuss, the Executive 1l.r"ice President of Global Product Development, and Dan Ammann, brought together chief engineers and regional presidents to make tradeoffs and look for efficiency gains across product programs.55 This group rationalized product lines and optimimd manufacturing plans. 218-026 GM's Capital Allocation Framework Incentive Cmnpmsation: The capital allocation framework was also incorporated into incentive compensation schemes for GM executives. These executives participated in a shortterm incentive program (STEP) and a longterm incentive program fLTIP).34 The STIP included targets based on four measures, and executives received varying percentages of a payout amount depending on performance. The tour measures were adjusted EBlT, free cash flow {which essentially measured operating cash flows less capital expenditures), :Inarlcet share, and quality {which reected customer retention, incidents per 1,001] vehicles, and policy and warranty costs]. The LTlP had two components: restricted stock units {RSUs} and performance stock units (PSUs). 35% of the LTlP took the form of PSUs for senior executives, but only 50% for other executives. RSUs were time based, and individuals received grants with threeyear vesting periods. PSUs were granted on a rolling basis and tied to performance over specic threeyear periods. The primary performance measure was ROIC, subject to a modier based on market share. 35 If GM achieved a 20% ROIC over the relevant three year period, an executive could receive 100% of the PSU target payout. Payout percentages were 0% for RIDICs of less than 16% and increased to 200% for ROICs above 24% . Market share performance would not affect the value of PSUs over a certain band, but if market share fell below that band, there would be a 25% deduction in value and it market share fell above the band, there would be a 25% increase in value. Looking to the Future ICtllver the last several years, GM performance had illustrated consistent improvement, and there were indications this trend would continue. In April of 2015, GM reported EBTFadjusted tor the first quarter of 2015 was $2.1 billion, up $0.3 billion from the first quarter of 2014. The stock price was around $36. GM faced keyr decisions regarding its operations in Russia and Europe, and concerning the changes in its industry. The refinement of management practices governing how capital would be allocated provided reason for optimism. In the earnings release, Earra stated, "Continued execution of our plan, including our capital allocation h'antework, will drive protable growth, return on invested capital, and shareholder value.\" 36 GM'S Capital Allocation Framework On March 9, 2015, a group of senior leaders at General Motors (GM), including CEO Mary Barra, CFO Chuck Stevens, President Dan Aminann, and Executive Director of Communications and Investor Relations Randy Alickx, hosted a conference call to explain the details of their newlyestablished capital allocation framework. This framework reected many operating principles that had developed as GM's performance recovered following the financial crisis, and it addressed some issues a group of activist investors had recently raised. In early 2015, Harry J. Wilson, who had served on the Auto Task Force that helped GM undergo a govemmentiled restructuring during the recent economic crisis, disclosed plans to nominate himself to GM's board of directors.1 Wilson indicated he was acting in conjunction with four investment funds, including Appaloosa Management LP and Hayman Capital Management LP. Wilson wanted GM to repurchase $8 billion in stock and noted that there were significant opportunities for GM to grow its profit margins, which had not increased much since 2010. There were three tenets of GM's new capital allocation framework.2 First, GM would invest with the objective of obtaining, on a consolidated basis, a 20% or higher return on invested capital (ROIC). Recent efforts to enhance capabilities to measure protability levels with a full allocation of costs allowed GM to track returns throughout the film and to impose greater discipline when consideiing opportunities. Second, GM would intend to maintain an investmentsgrade balance sheet with a target cash balance of $20 billion. This capital structure choice aimed to ensure that GM had the minimum level of cash it needed to run the business in addition to a buffer of capital that could be drawn upon in the event of a recession of average magnitude. The third tenet was that once investment and balance sheet needs were met, GM would return all available free cash ows to investors in the form of dividends or share repurchases. In keeping with this tenet, GM announced plans to repurchase $5 billion of GM shares by the end of 2016 at the same time as it announced its commitment to the capital allocation framework. Following these announcements, Wilson withdrew his plan to become a GM director, but a number of questions and decisions loomed large. Would the capital allocation framework help GM managers deploy capital in a more efficient manner? How would analysts and investors respond to it? Would it drive increased returns to shareholders? What implications did the framework have for strategic choices that GM faced? GM's Capital Allocation Framework 218-026 Management Many of GM's corporate officers had recently taken on their roles. Mary Barra became CEO in 2014. She started her career at GM in the Pontiac Motor Division as a General Motors Institute co-op student and had spent her entire career at the company. Chuck Stevens, who was named CFO in January 2014, also was a GM lifer. After he graduated from General Motors Institute, he joined the Buick Motor Division. He helped form the Shanghai Automotive Industry Corporation (SAIC) and GM joint venture in China and held several leadership positions in Asia, North America, and South America. Dan Ammann preceded Stevens as CFO and became President in 2014. Ammann joined GM from Morgan Stanley, where he advised GM during its 2009 restructuring. Two other managers who would play a role in the implementation of the capital allocation framework were Dhivya Suryadevara and Rick Westenberg. Suryadevara, who received her MBA from Harvard Business School in 2003, was GM's Treasurer and the CEO and Chief Investment Officer of GM Asset Management. Her responsibilities included capital planning capital market activities, worldwide banking, and the overall strategy and management of GM's pension plans. Westenberg served as Executive Director of Corporate Financial Planning and Analysis (FP&A). Operations, Products and Services GM's automotive operations were organized into four regional segments: GM North America (GMNA), GM Europe (GME), GM International Operations (GMIO), and GM South America (GMSA). Exhibit 5 provides basic performance data for these segments, and Exhibit 6 presents retail vehicle sales data and market share data by segment. GMNA primarily met the demands of customers in North America with vehicles developed, manufactured, and marketed under the Buick, Cadillac, Chevrolet, and GMC brands. At the end of 2014, GM held a 16.9% retail vehicle market share in North America. Outside of North America, the Buick, Cadillac, Chevrolet, GMC, Holden, Opel and Vauxhall brands were predominant. GM was also part of many joint ventures, the largest of which was Shanghai General Motors. Under its global and regional brands, GM produced a wide variety of cars, trucks, crossovers, and SUVs, which sold at a broad range of price points. In 2014, GM had U.S. retail sales of roughly 1.1 million cars, 1.1 million trucks, and 700,000 crossovers. Some of these were powered with alternative propulsion systems. GM began selling the plug-in hybrid Chevrolet Volt in 2010, and in early 2015 it announced that the all-electric Chevrolet Bolt was headed for production. One component of retail sales was sales to fleet customers, which included rental car companies, commercial fleet customers, leasing companies, and governments. Such sales accounted for 19.2% of the total global sales in 2014.15 GM vehicles were primarily marketed and sold through a network of more than 20,000 dealerships around the world. These dealerships were independent from GM and were authorized to sell GM vehicles at approved locations. Although GM sold off its ownership interest in what had been called the General Motors Acceptance Corporation, or GMAC, between 2006 and 2013, GM continued to provide financial services through GM Financial, which, among other activities, provided retail loans and offered lease programs to automotive customers. 1 To finance these loans and leased equipment, it relied primarilyGM'E Capital Allocation Framework 21m Different OEMs appeared to be taking different approaches to these changes. For example, senior managers at Ford signaled they did not perceive a need to be the first to sell autonomous vehicles, but they did want to democratize technology and make it available through its product lines.25 The uncertainty and potential hazards of selfdriving technologies made it possible that vehicle owners would have a strong preference to use DELI service processes and use original equipment for maintenance and repairs. Regardless of approach, widespread use of autonomous vehicles had the potential to present a significant opportunity for auto GEMS and dealer networks. The Capital Allocation Framework GMs new capital allocation framework aimed to allow it to build on its history and ourish in its industry. Efforts to enhance measures of protability and new perspectives about leverage laid the ground work. for the development of this framework. Historically, there had been a great deal of attention paid to the prot and loss statements [PrLs] of individual legal entities that were a part of GM Following the 2MB crisis, there were concerns that these PrLs were not precise enough because they were a function of transfer prices negotiated within the firm. There was a risk that some parts of GM could appear to perform well because managers had been successful innegotiatingfavorable terms in transactions with other parts of GM. To strengthen the finance function, GM developed point of sale reporting capabilities, which allowed managers to measure protabilityin a manner that fully allocated corporate costs. As a consequence, there was more clarity about profitability at the country and product level, thus raising the possrbility of conducting deeper analysis of whether re rm was generating appropriate levels of returns on the capital it deployed in different locations. The crisis also pointed out the value of liquidity. The capital intensive nature of GM's activities generated signicant operating leverage, and decreases in sales generated large cash needs. Given that margins were not high and that the crisis illustrated how cyclical the auto industry could be, the benefits of a fortress balance sheet capable of withstanding a downturn became clear. GMs capital allocation framework had three tenets that related to the desire to bolster the RIDIC of the business, maintain an investmentgrade balance sheet, and increase the return of capital to shareholders. ROIC afne Business: The rst tenet was that GM would reinvest in the business to drive 20% or higher ROIC on a consolidated level. Exhibit 8 provides information about how ROTC was computed. The nunrerator of this ratio was earnings before interest and taxes adjusted for special items, or adjusted EBTT. Adjusted EBIT had been used throughout the rm as a performance metric for some time. The denominator was a measure of net assets that excluded the value of deferred income taxes and goodwill. A 2TH: target through the business cycle would place GM in the top quartile of automakers. Exhibit 9 presents some capital market data. GM planned to compute ROTC using the trailing four quarters of data each quarter, communicate it widely within the firm, and present it in quarterly earnings releases. Within the rm, it was possible to measure FDIC at the country, regional, and global level. It was also possible to measure RIDIC for product programs. The ruse consolidated target had implications for target returns of different kinds of investments, which tended to have different kinds of returns. GM was spending about $9 billion a year in capital expenditures. Approxinrately WEI. of this was on product programs, and the objective for these was ZD'H: to 25% on average, with some variation. For example, luxury and full size trucks tended to have higher margins than other vehicles. In aggregate industry data, these segments accounted for about 213-026 Git-E's Capital Allocation Framework Some of these choices related to how much GM should invest in its European operations, with particular focus on Russia due to its recent lackluster performance. GM had opened a plant in St Petersburg in July 2008 that produced the Chevrolet Captive and Opel Antara. It had a capacity of 95,000 vehicles per year and employed about 1,000 peoples Weak macroeconomic conditions and significant devaluation of the rouble dragged down performance. To comply with new regulations that governed local content requirements and continue manufacturing activities in Russia, GM would need to spend approximately $1 billion5 More generally, GM had been spending about $9 billion a year on capital investments that aimed to ensure it launched leading products at the right cadence, and the new framework highlighted the required returns associated with these investments. A number of innovations with large potential consequences were also on the horizon for GM. Industry projections suggested that sales of electric vehicles would grow quickly. Advances in driver assistance technology allowed cars to perform rrLany operations on their own, and a dozen manufacturers were testing fully autonomous vehicles in public. Emerging business models for ridesharing and carshaiing were proving to be effective. These changes had the ability to disrupt the nature of the auto industry. Company Background History GM was founded in 1903 by William Durant, who combined several motorcar companies operating in the early 20th century into a single conglomerate. In 1920, Durant was succeeded by Alfred P. Sloan, Ir. Sloan restructured the company into five main automobile divisions: Cadillac, Buick, Pontiac, IE'tllldszli'iobile, and tCCl"|evi'olet.'5 The company soon became the world's largest automaker in unit sales terms and accounted for about 40% of U5. automobile sales in the 19505 and 1960s.? Increased competition, largely from Japanese automakers, posed signicant challenges in the later part of the 13101:?l century. After being the world's sales volume leader for '5"? years, GM was surpassed by Toyota in 2903.3 The financial crisis that started in 2003 was associated with a sharp decline in auto sales. To sustain the industry, the federal government responded by implementing an emergency nancial rescue plan under the Troubled Assets Relief Program {TARP}. GM received $13.4 billion in emergency aid from the Treasury Department at the end of 2008, but rising debt soon forced the company to file for Chapter 11 reorganization? As part of this reorganization, GM was split into two entities. lCine included four major brands, namely Chevrolet, Cadillac, GMC, and Buick, and it became the new General Motors. Other parts of the rm became part of what was called Motors Liquidation Company, and they were subsequently sold off or closed down. To support GM through the restructuring process, the US. Treasury Department provided GM with an additional $36.1 billion in funding and obtained 61% of GM equity.\" GM reported healthy profitability in each of the years following the restructuring. In November 2010, GM listed on the New York Stock Exchange and the Toronto Stock Exchange in one of the largest IPCts in history. By 2013, the federal government effectively exited Ghrf by selling off its remaining shares and recovered roughly $39 billion:11 Exhibit 1, Exhibit 2, and Exhibit 3 provide income statement, balance sheet data, and cash ow statements for Glad, respectively. Exhibit 4 displays GM's recent stock market performance, as well as the performance of GM's longtime competitors. 213-026 GM's Capital Allocation Earner-fork on secured and unsecured credit facilities. GM also owned OnStar, a subsidiary that provided safety, security, and mobility solutions to more than 6 million subscribers.\" Industry Context The automotive industry had been a highly cyclical industry. Automobile companies had receny beneted from increased sales and production volume following the 2008 crisis. Total U.S. motor vehicle sales, which include passenger cars, as well as light, medium, and heavy trucks, grew from 10.6 million units in 2009 to 16.8 million units in 2014.13 During this period, passenger car sales increased from 5.4 million to 57.? million units, light truck les increased from 5.0 million In 3.? million units, and medium and heavy truck sales increased from 20.1,!)[1] to 407,000 units. In the US. market in 2014, GM held a 13.5% and 20.6% market share in passenger cars and light trucks, respectively. Global automobile demand had been on the rise as well. According to a Global Industry Report created by the Economist Intelligence Unit, global new passenger car registrations grew from 51.4 million in 2L0) to 20.1 million in 2014. This growth was largely driven by increased registrations in North America and Asia. Although growth was expected to continue, the main sources of increased sales were projected to be outside of North America and Western Europe. Exhibit T provides data on historical and projected passenger car registrations in different regions of the world. The traditional auto sector faced potential disruption from a variety of sources. Environmental concerns, tightening CO2 emissions regulations, and high fuel prices had encouraged a shift to electric vehicles. Global annual sales of plugin electric vehicles increased from 45,000 in 2011 to 30?,[110 in 2014. Regulations were expected to become more stringent, and some projected that electric vehicles would becorrLe 10 to 15 percent of the global auto market by 2020.19 Two other significant shifts in the automotive industry related to the growth of shared mobility and the development of autonomous vehicles. Ridesharing businesses like Lyft and Uber and carsharing businesses like Zipcar aimed to exploit the fact that, on average, cars sat idle 96% of the time.\" Such businesses could become especially powerful if cars were selfdriving. A variety of technology and auto firms were racing to create a fully autonomous vehicle that could be summoned by a passenger and programmed to travel to a desired destination Although the required technologies were still under development, Google believed that car utilization rates could increase to 15% due to these advances?1 The development of shared mobility, and especially autonomous shared mobility, could have a big impact on the demand for vehicles and the protability of original equipment manufacturers (OEMs). Many industry experts believed that levels of vehicle sales would fall. Morgan Stanley forecasted worldwide growth in vehicle production would fall to 0% by 2025 and rerriain there until 2030, as the traction of shared cars on the road grew to 15'343.22 Barclays predicted US. auto sales would fall by 40% by 2040.25 OHIEIB presented less dour outlooks. Deutsche Bank analysis pointed out that cars would be driven more miles, especially if there were many empty legs in trips, and therefore they would need to be replaced more frequently.24 It was not clear which firms were well positioned to capture the value that was associated with these changes. Returns historically earned by vehicle manufacturers could go to whoever produced the software, owned the data, and provided coordination services. Consumers who had valued the appearance and driving experience of certain product lines might shift their focus to autonomous functionality and convenience. 213-1126 GM's Capital Allocation Ftamewurk 14% of global industry units but about are of global industry profits.26 lGross margins in the automobile industry also varied significantly with production volume because many automobile production costs were fixed. Production was a capital intensive process, and union contracts constrained the extent to which labor costs could be cut during a downturn. Early stage product lines, like the Chevy 1Volt and Bolt, had not yet reached significant scale, making it difficult to achieve high levels of RDIC. The remainder of capital expenditure dollars were spent in close to equal amounts on asset sustairunent and business model improvements. Asset sustairunent included maintenance expenditures for processes such as fixing roofs and conveyor belts at manufacturing facilities, and these did not generate marginal returns for GM Business model improvements were assigned a relatively high Rorc target. InusshnentGmde Balance Sheet: As a second tenet, GM intended to maintain an investmentgrade balance sheet with a target cash balance of $29 billion. This capital structure would allow GM to continue to meet operational and nonoperational obligations during an average recession. The minimum cash required for steady state operating needs under such circumstances was estimated to be about $3 billion. This amount would meet needs generated from seasonality and accounted for roughly $3 billion in cash held overseas that could be costly to access in the US. An additional $1 to $11 billion was required to support liquidity needs during an average recession th5 automotive accounts payable tended to exceed its automotive accounts receivable, and about $5 to $6 billion in liquidity would cover the working capital needs of an average recession. Because earnings would likely suffer, making interest payments and maintaining the dividend required an additional $5 billion. The amount required to have sufficient liquidity during a recession was lower than it had been in the past because Ghu'f had lowered its break even volumes on a global basis from more than .7" million in 20:]? to roughly 5 million.\" Bringing the total cash target to $21] billion, an additional $1 to $2 billion in cash was required to meet expectations of rating agencies.23 Pension obligations could in'Lpact GM's liquidity needs and intention to maintain an investment grade rating. hianagers had taken signicant steps to reduce the size and risk of pension benet obligations since the time of the crisis. GM had unfunded pension liabilities of approximately $24 billion at the end of the first quarter of 2015, but it did not face any rrLaterial n'Landatory contributions related to its US obligations for the next ve years.Ea These US obligations comprised about half of all obligations. Return (initial to Shareholders: The third tenet of the capital allocation framework was that any cash that was not required to meet the objectives of the first two tenets should be returned to shareholders through dividends and repurchases. To inrplernent this tenet, senior management would analyze current and forecast cash generation, as well as projected investment needs, and make a recommendation to the Board of Directors concerning payouts. A strong dividend served as a disciplinary device, and decisions about dividends accounted for the desire to maintain the dividend through an average recession. GM management widely held the view that GM shares were undervalued, making repurchases particularly attractive. Speaking on the investor call when the capital allocation framework was announced, CFO Chuck Stevens said, \"Given the current condition of our balance sheet and the fact that we believe we are appropriately deploying capital for strong risk. adjusted returns on our core businesses, we believe an initial $5 billion share buyback is good for our owners because we cannot earn better returns by investing that cash in the business at this time. In addition, webelieve the stock is undervalued, and a stock buyback should generate a signicant return opportunity for our owners."5"" GM's Capital Allocation Framework 218-026 Exhibit 1 GM's Consolidated Income Statement (in millions, except per share amounts) 2014 2013 2012 Net sales and revenue Automotive $151,092 $152,092 $150,295 GM Financial 4,837 3,335 1,961 Total net sales and revenue 155,929 155,427 152,256 Costs and expenses Automotive cost of sales 138,082 134,925 140,236 GM Financial interest, operating and other expenses 4,039 2,448 1,207 Automotive selling, general and administrative expense 12, 158 12,382 14,031 Goodwill impairment charges (Note 9) 120 541 27,145 Total costs and expenses 154,399 150,296 182,619 Operating income 1,530 5,131 (30,363) Automotive interest expense 403 334 489 Interest income and other non-operating income, net 823 1,063 845 Gain (loss) on extinguishment of debt 202 (212) (250) Equity income 2,094 1,810 1.562 Income before income taxes 4,246 7,458 28,695) Income tax expense (benefit) 228 2,127 (34,831) Net income 4,018 5,331 6,136 Net (income) loss attributable to non-controlling interests (69) 15 52 Net income attributable to stockholders $3,949 $5,346 $6,188 Net income attributable to common stockholders $2,804 $3,770 $4,859 Earnings per Share: Basic Basic earnings per common share $1.75 $2.71 $3.10 Weighted-average common shares outstanding 1,605 1,393 1,566 Diluted Diluted earnings per common share $1.65 $2.38 $2.92 Weighted-average common shares outstanding 1,687 1,676 1,675 Source: GM SEC filings.218-026 GM's Capital Allocation Framework Exhibit 2 GM's Consolidated Balance Sheet (in millions, except per-share amounts) 2014 2013 2012 ASSETS Current Assets Cash and cash equivalents $18,954 $20,021 $18,422 Marketable securities 9.222 8,972 8.988 Restricted cash and marketable securities 1,338 1,247 686 Accounts and notes receivable 9,078 8,535 10,395 GM Financial receivables, net 16,528 14,278 4.044 Inventories 13,642 14,039 14,714 Equipment on operating leases, net 3,564 2,398 1,782 Deferred income taxes 9,760 10,349 9,429 Other current assets 1,540 1.662 1.536 Total current assets 83,626 81,501 69,996 Non-current Assets Restricted cash and marketable securities 935 829 682 GM Financial receivables, net 16,006 14,354 6,954 Equity in net assets of nonconsolidated affiliates 8,350 8,094 6,883 Property, net 27,743 25,867 24,196 Goodwill and intangible assets, net 6,410 7,228 8.782 GM Financial equipment on operating leases, net 7,060 3,383 1,649 Deferred incom 25,414 22,736 27,922 Other assets 1,957 2.352 2.358 Total non-current assets 93,875 84,843 79,426 Total Assets $177,501 $166,344 $149,422 LIABILITIES AND EQUITY Current Liabilities Accounts payable (principally trade) 622,529 $23,621 $25,166 Short-term debt and current portion of long-term debt Automotive 497 564 1,748 GM Financial 14,447 13,594 3,770 Accrued liabilities 28. 184 24,633 23.308 Total current liabilities 65,657 62,412 53,992 Non-current Liabilities Long-term debt Automotive 8,853 6,573 3,424 GM Financial 22,868 15.452 7,108 Postretirement benefits other than pensions 6,229 5.897 7,309 Pensions 23,788 19,483 27,420 Other liabilities 14,082 13,353 13,169 Total non-current liabilities 75,820 60,758 58,430 Total Liabilities 141,477 123,170 112,422 Commitments and contingencies Equity Common stock, $0.01 par value 16 15 14 Additional paid-in capital 28,937 28,780 23,834 Retained earnings 14.577 13,816 10.057 Accumulated other comprehensive loss (8,073 (3,113) (8,052) Total stockholders' equity 35,457 42,607 6,244 Noncontrolling interests 567 567 756 Total Equity 36,024 43, 174 37,000 Total Liabilities and Equity $177,50 $166.344 $149,422 Source: GM SEC filings. 10GM's Capital Allocation Framework 218-026 Exhibit 3 GM's Consolidated Statements of Cash Flows (in millions) 2014 2013 2012 Cash flows from operating activities Net incomes $4,018 $5,331 $6,136 Depreciation, amortization and impairment charges 7.238 8.041 38,762 Foreign currency remeasurement and transaction losses 437 350 117 Amortization of discount and issuance costs on debt issues 181 114 188 Undistributed earnings of nonconsolidated affiliates and gains on investments (301) (92) (179) Pension contributions and OPEB payments (1,315) (1,458) (3,759) Pension and OPEB expense, net 439 638 3,232 (Gains) losses on extinguishment of debt (202 212 250 Provision (benefit) for deferred taxes (574) 1,561 (35,561) Change in other operating assets and liabilities 244 (1,326 630 Other operating activities (107 (741) 789 Net cash provided by operating activities 10,058 12,630 10,605 Cash flows from investing activities Expenditures for property (7,091) (7,565) (8,068) Available-for-sale marketable securities, acquisitions (7,636) (6,754) (4,650 Trading marketable securities, acquisitions (1,518) (3,214) 6,234) Available-for-sale marketable securities, liquidations 6,874 3,566 10,519 Trading marketable securities, liquidations 1,881 6,538 7,267 Acquisition of companies, net of cash acquired (53) (2,623) (44) Proceeds from sale of business unites/investments, net of cash disposed 896 18 Increase in restricted cash and marketable securities (839) (984) (661) Decrease in restricted cash and marketable securities 515 1,107 1,526 Purchase of finance receivables (14,744) (10,838) 6,122) Principal collections and recoveries on finance receivables 10,860 7,555 4,007 Purchases of leased vehicles, net (4,776) (2,254) (1,050) Proceeds from termination of leased vehicles 533 217 59 Other investing activities 296 (9) (72) Net cash used in investing activities (15,698) (14,362) (3,505) Cash flows from financing activities Net increase (decrease in short-term debt 391 156 (247) Proceeds from issuance of debt (original maturities greater than three months) 31,373 28,041 9,036 Payments on debt (original maturities greater than three months) (19,524) (20,191) (7,377) Payments to purchase stock (3,277) (2,438) (5,098) Dividends paid (including charge related to redemption and purchase of Series A Preferr (3,165) (1,687) 939) Other financing activities (123 (150) (116) Net cash provided by (used in) financing activities 5,675 3,731 (4,741) Effect of exchange rate changes on cash and cash equivalents (1,102) (400 (8) Net increase (decrease) in cash and cash equivalents (1,067) 1,599 2,351 Cash and cash equivalents at beginning of period 20,02 18,422 16.071 Cash and cash equivalents at end of period $18,954 $20,021 $18,422 Significant Non-cash Activity Investing Cash Flows Non-cash property additions $3,313 $3,224 $3,879 Financing Cash Flows Mandatory conversion of Series B Preferred Stock into common stock $4,854 Source: GM SEC Filings. 11218-026 GM's Capital Allocation Framework Exhibit 8 GM's ROIC Calculation (in billions) 2014 2013 2012 EBT (Income (loss) before income taxes) 4.25 7.46 (28.69) Add Backs: Interest Expense 0.40 0.33 0.49 Interest Income (0.21) (0.25) (0.34) EBIT 4.44 7.55 (28.54) Net (income) loss due to non-controlling interests (0.07) 0.02 0.05 Gain/(Loss) on Extinguishment of Debt 0.20 0.21 0.25 Total Add-Backs (0.27) 0.23 0.30 Special Items: Goodwill Impairment Charge 0.10 0.40 27.10 Impairment Charges of Property and Intangible Assets 0.40 0.80 5.50 Pension Settlement Charges 0.10 2.70 Venezuela Currency Devaluation 0.40 0.20 GM Korea Wage Litigation (0.60) 0.30 Recall Campaign Catch-up Adjustment 0.90 Ignition Switch Recall Compensation Program 0.40 Russia Exit Costs Flood Damage 0.10 Switch DOJ Financial Penalty gnition Switch Civil Litigation Charges GM Korea Preferred Shares Acquisition (0.10) Other 0.50 Total Special Items 2.30 0.80 36.10 EBIT-adjusted 6.47 8.57 7.86 Average Equity 41.30 39.50 40.30 Average automotive debt and interest liabilities (excluding capital leases) 6.80 5.00 4.20 Average automotive net pension & OPEB liability 26.60 32.60 33.30 Average fresh start accounting goodwill (0.10) (0.50 (20.50) Average automotive net income tax asset 32.40) (34.10 (8.40) ROIC average net assets 42.20 42.50 49.00 ROIC 15.32% 20.17% 16.04% Recall Related 5.40% 0.00% 0.00% ROIC-adjusted (excluding recall) 20.72% 20.17% 16.04% Source: GM Investor Presentations "Driving Shareholder Value," March 2015 and "General Motors: Strategic and Operational Overview," October 28, 2016. Note: The change in ROIC average net assets is largely a consequence of some 2012 changes that affected the balance sheet. GM took a goodwill impairment charge of $27.1 billion and recognized a deferred tax valuation release of $36.2 billion. The increase in deferred income taxes relates to tax-loss carryover credits, and both of these changes were induced by improvements to GM's performance. 16