

Question: GNR Inc (All Analysis for GNR only) Ja. Do a horizontal analysis for GNR Inc for years 2019 2018 Calculate the profitar for each year
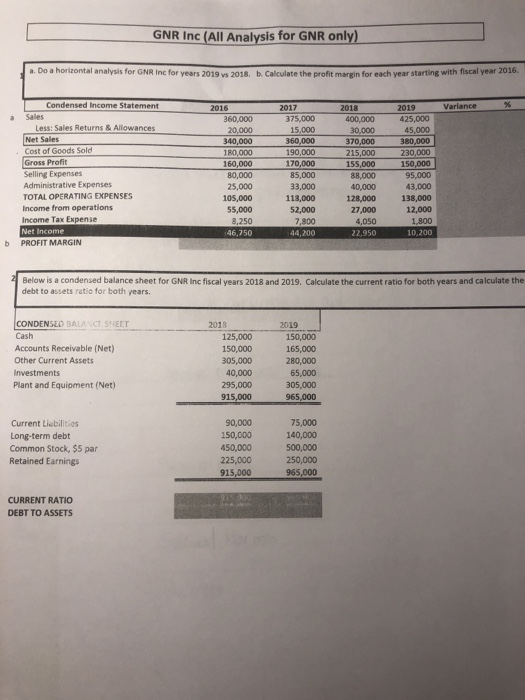
GNR Inc (All Analysis for GNR only) Ja. Do a horizontal analysis for GNR Inc for years 2019 2018 Calculate the profitar for each year starting with fiscal year 2016 Variance Condensed Income Statement Sales Less: Sales Returns & Allowances Net Sales Cost of Goods Sold Gross Profit Selling Expenses 2016 360.000 20,000 340.000 180,000 160,000 80,000 25,000 105,000 55,000 3.250 46.750 2017 375.000 15.000 360,000 190,000 170,000 85,000 33,000 113,000 52,000 7.300 44,200 2018 400,000 30.000 370,000 215,000 155,000 88000 40,000 120,000 27,000 4,050 2019 425,000 45.000 380,000 230,000 150,000 95,000 43,000 138,000 12.000 1.800 10.200 TOTAL OPERATING EXPENSES Income from operations Income Tax Expense Net Income PROFIT MARGIN Below is a condensed balance sheet for GNR Inc fiscal years 2018 and 2019. Calculate the current ratio for both years and calculate the debt to assets ratio for both years. CONDENSED A T Cash Accounts Receivable (Net) Other Current Assets Investments Plant and Equipment (Net) 2018 125,000 150,000 305,000 40,000 295,000 915,000 2019 150,000 165,000 280,000 65,000 305,000 965,000 Current Liabilities Long-term debt Common Stock, 55 par Retained Earnings 90,000 150,000 450,000 225,000 915,000 75,000 140,000 500,000 250,000 965,000 CURRENT RATIO DEBT TO ASSETS
Step by Step Solution
There are 3 Steps involved in it

Get step-by-step solutions from verified subject matter experts