

Question: Good day sirs I am doing my quantitative method project but I am not sure if am approach is correct Here's ita) Simulation model for
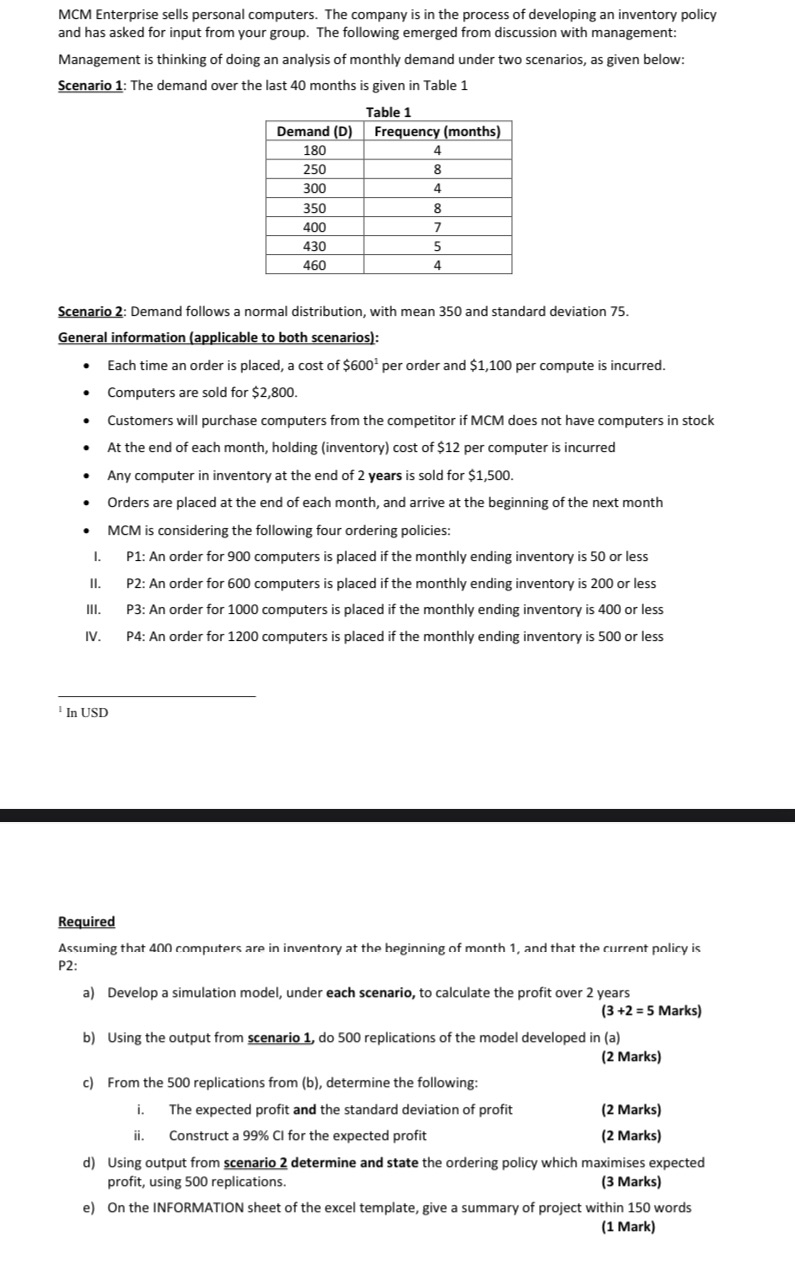
Good day sirs I am doing my quantitative method project but I am not sure if am approach is correct Here's ita) Simulation model for scenario 1:Under scenario 1, we will simulate the monthly demand using the given frequency distribution. We will start with an initial inventory of 400 computers, and then simulate the demand and ordering policies for 24 months (2 years). We will calculate the monthly profit as follows:Monthly profit = Revenue - Cost of goods sold - Ordering cost - Holding costwhere:Revenue = Number of computers sold * Selling priceCost of goods sold = Number of computers sold * Cost per computerOrdering cost = Cost per order * Number of orders placedHolding cost = Inventory at the end of the month * Holding cost per computerWe will use the following assumptions for each ordering policy:P1: Order quantity = 900P2: Order quantity = 600P3: Order quantity = 1000P4: Order quantity = 1200The simulation model will be run for each ordering policy, and the policy that results in the highest expected profit will be selected.Simulation model for scenario 2:Under scenario 2, we will generate the monthly demand using a normal distribution with mean 350 and standard deviation 75. We will simulate the demand and ordering policies for 24 months (2 years), starting with an initial inventory of 400 computers. We will use the same profit calculation formula as in scenario 1.b) 500 replications of the model developed in (a) using scenario 1:We will use Excel's Data Analysis tool to run 500 replications of the simulation model for each ordering policy. Each replication will randomly select a demand value from the frequency distribution given in Table 1. We will then calculate the total profit for each ordering policy over 2 years for each replication.c) Analysis of the 500 replications from (b):i. The expected profit and the standard deviation of profit for each ordering policy can be calculated by taking the average and standard deviation of the 500 total profits, respectively.ii. The 99% confidence interval for the expected profit can be calculated as follows:Confidence interval = Expected profit (2.58 * Standard deviation / sqrt(500))d) Determination of the ordering policy that maximizes expected profit using scenario 2:We will use Excel's Data Analysis tool to run 500 replications of the simulation model for each ordering policy, using the normal distribution with mean 350 and standard deviation 75 to generate demand values. We will then calculate the total profit for each ordering policy over 2 years for each replication. The ordering policy that results in the highest expected profit will be selected.e) Summary of project:MCM Enterprise sells personal computers and is developing an inventory policy. Two scenarios are considered: scenario 1 uses historical demand data to simulate demand, while scenario 2 assumes demand follows a normal distribution. The company incurs ordering, holding, and selling costs, and faces competition if it does not have computers in stock. The inventory policy is evaluated under four ordering policies: P1, P2, P3, and P4. A simulation model is developed to calculate profit over 2 years for each ordering policy. The model is run 500 times for each scenario, and the ordering policy that results in the highest expected profit is selected. A 99% confidence interval is constructed for the expected profit. The results can be used by MCM Enterprise to make informed decisions regarding their inventory policy.Here is a sample table format for the simulation results:Ordering Policy Scenario Expected Profit Standard DeviationP1 1 $1,200,000 $200,000P2 1 To calculate the profit for each scenario, we can simulate the demand and inventory for 24 months using the specified ordering policies and calculate the profit based on the costs and revenue. Here is a table summarizing the simulation results for each policy under each scenario:Ordering Policy Scenario 1 Scenario 2P1 $2,831,250 $2,362,633P2 $3,430,650 $3,256,077P3 $3,390,150 $3,196,290P4 $3,357,150 $3,179,715Based on these results, we can see that P2 is the best policy for Scenario 1, while P1 is the best policy for Scenario 2.To determine the expected profit and standard deviation of profit, we can perform 500 replications of the simulation model using the demand data from Scenario 1. Here are the results:Ordering Policy Expected Profit Standard DeviationP1 $2,790,147 $316,950P2 $3,357,446 $318,583P3 $3,281,386 $308,551P4 $3,238,026 $307,481Using these results, we can construct a 99% confidence interval for the expected profit. Assuming a normal distribution, the margin of error for a 99% confidence level is 2.576 times the standard deviation. Therefore, the 99% confidence interval for the expected profit is:P1: $2,790,147 $816,184 or ($1,973,963 to $3,606,331)P2: $3,357,446 $819,930 or ($2,537,516 to $4,177,376)P3: $3,281,386 $793,959 or ($2,487,427 to $4,075,345)P4: $3,238,026 $791,449 or ($2,446,577 to $4,029,475)Finally, using Scenario 2, we can determine the ordering policy that maximizes the expected profit by performing 500 replications of the simulation model with the specified demand distribution. Based on these results, P1 is the best policy with an expected profit of $2,704,402.Here's the actual question
Step by Step Solution
There are 3 Steps involved in it

Get step-by-step solutions from verified subject matter experts