

Question: Good day Statistical Methods Tutors, I would like some detailed assistance and explanation for the following I nference for Paired Sample Exercise 1. Micro, Small
Good day Statistical Methods Tutors, I would like some detailed assistance and explanation for the following Inference for Paired Sample Exercise


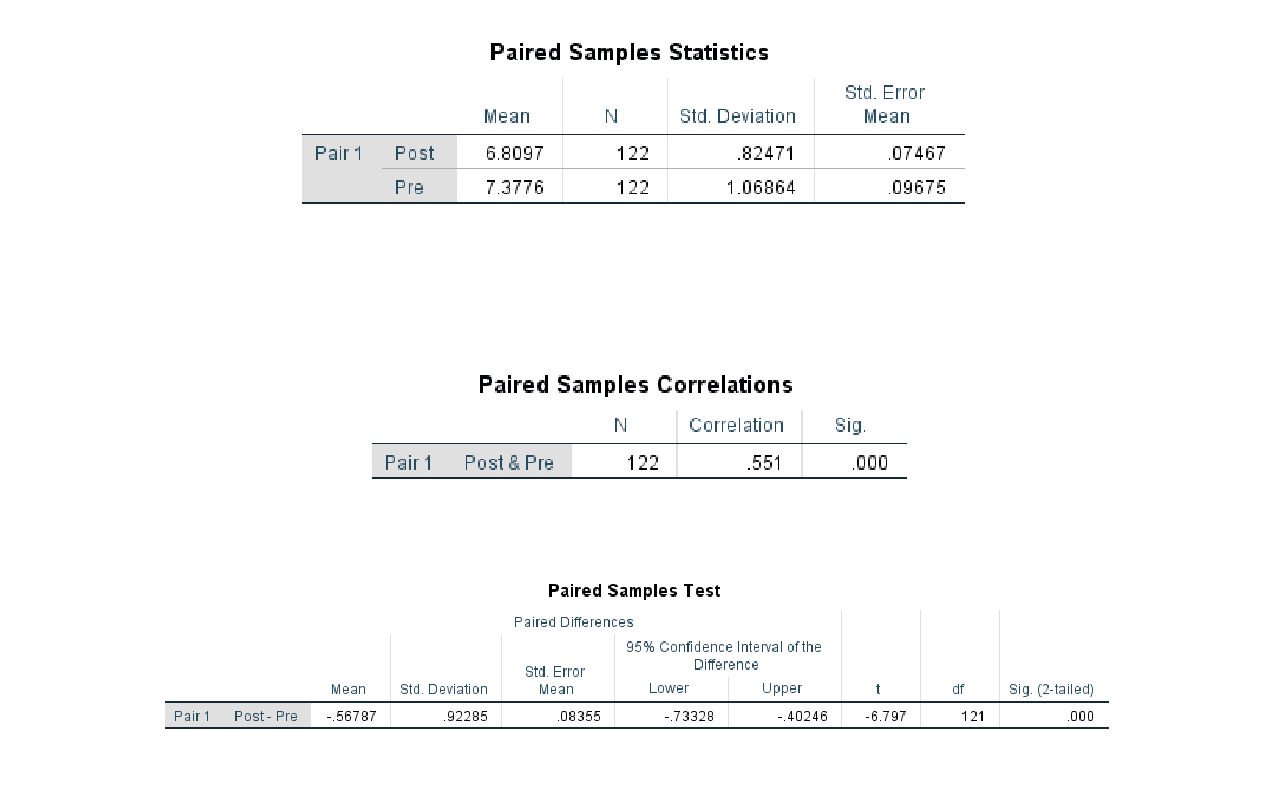
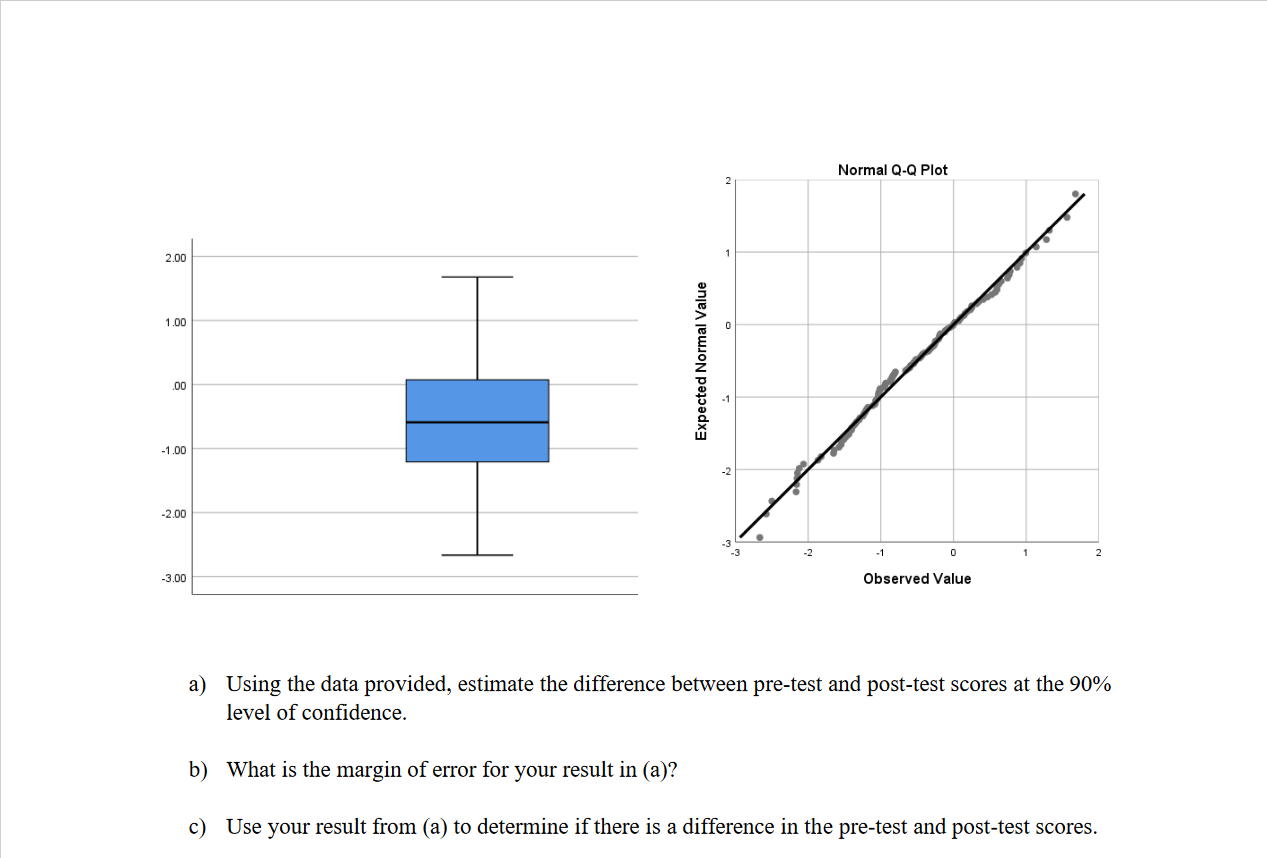

1. Micro, Small and Medium Enterprises (MSMEs) are known to contribute significantly to a country's economy. The infographic below highlights some of these contributions to the Jamaican economy. MINISTRY OF INDUSTRY, COMMERCE, AGRICULTURE & FISHERIES MSME POLICY DIVISION PROJECTS PARTNERSHIP MSME FACTS . They represent over 90% of the private sector MSMEs represent 34% of the employed labour force Contributed over $100 billion in taxes Source: Ministry of Industry, Commerce, Agriculture and Fisheries, Government of JamaicaWhile making significant contributions, many MSMEs fail because of their limited knowledge of financial management and processes. In an effort to assist this group of businesses, many financial institutions have instituted departments that solely assist MSMEs. This includes notifying these businesses of special financial products and hosting educational seminars. One bank would like to determine if their education programme is effective. To do so, they collect data from a sample of MSMEs that participated in an educational seminar series. The organisers of the seminar gave the participants, who were CEOs of MSMEs, a knowledge test before and after the seminar. The results are presented below.Paired Samples Statistics Std. Error Mean N Std. Deviation Mean Pair 1 Post 6.8097 122 .82471 07467 Pre 7.3776 122 1.06864 09675 Paired Samples Correlations N Correlation Sig. Pair 1 Post & Pre 122 551 000 Paired Samples Test Paired Differences 95% Confidence Interval of the Std. Error Difference Mean Std. Deviation Mean Lower Upper df Sig. (2-tailed) Pair 1 Post - Pre -.56787 92285 08355 -.73328 . 40246 6.797 1212 DD 1 .00 DD -1 .00 72.00 -3.00 Normal 0-!) Plot Expected Normal Value .3 -2 -'l D | 2 Observed Value Using the data provided, estimate the difference between pre-test and post-test scores at the 90% level of condence. What is the margin of error for your result in (3)? Use your result from (a) to determine if there is a difference in the pre-test and post-test scores. i) Using the information provided, do you have any reason to be concerned about the validity of your results? Give reasons for your
Step by Step Solution
There are 3 Steps involved in it

Get step-by-step solutions from verified subject matter experts