

Question: Good Evening, I previously submitted a question but it had issues with formatting, please let me know if this works any better. I greatly appreciate
Good Evening,
I previously submitted a question but it had issues with formatting, please let me know if this works any better. I greatly appreciate any assistance as Statistics is not really my best Subject. Thank you.
The well-known Gold list for cruise ships is based on respondents who rate the cruise according to Shore Excursions and Food/dining. As a statistician you are asked to specifically determine how much these two variables (expressed in percentage) explain the overall rating of the cruise (also in percentage terms).
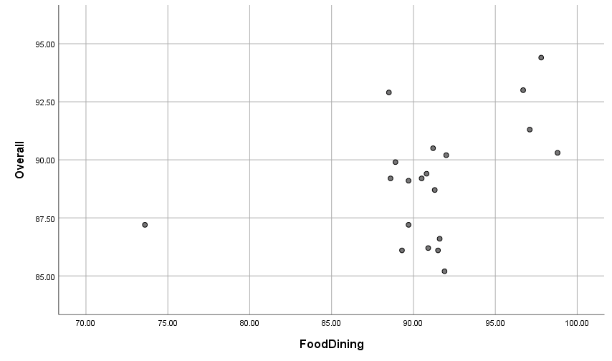
a.(1pt) Refer to scatter diagrams and comment on the relationship of each explanatory variable to the overall cruise score.
Answer:
Model 1 - run a regression using FoodDining as explanatory variable
1. (1pt) Comment on the goodness of fit of Model l.
Answer:
2.(1pt) Report the statistical significance of the model
Answer:
3.(1pt) Write the regression equation for Model 1.
Answer:
4.(1pt) Interpret the intercept.
Answer:
5.(1pt) Interpret the slope coefficient.
Answer:
6.(2pt) Report the statistical significance of all coefficients.
Answer:
Model Summary
Model R R Square Adjusted R Square Std. Error of the Estimate
1 .422 a .178 .132 2.37187
a. Predictors: (Constant), FoodDining
ANOVAa
Model Sum of Squares df Mean Square F Sig.
1 Regression 21.902 1 21.902 3.893 .064b
Residual 101.264 18 5.626
Total 123.166 19
a. Dependent Variable: Overall
b. Predictors: (Constant), FoodDining
Coefficientsa
Unstandardized Coefficients Standardized Coefficients
Model B Std. Error Beta t Sig.
1 (Constant) 70.181 9.621 7.295 .000
FoodDining .208 .106 . 422 1.973 .064
a. Dependent Variable: Overall
\f
Step by Step Solution
There are 3 Steps involved in it

Get step-by-step solutions from verified subject matter experts