

Question: Google Weekly Return 2. For data of weekly returns (in %) of Google stock (GOOGL) given here, forecast the return for the week of June
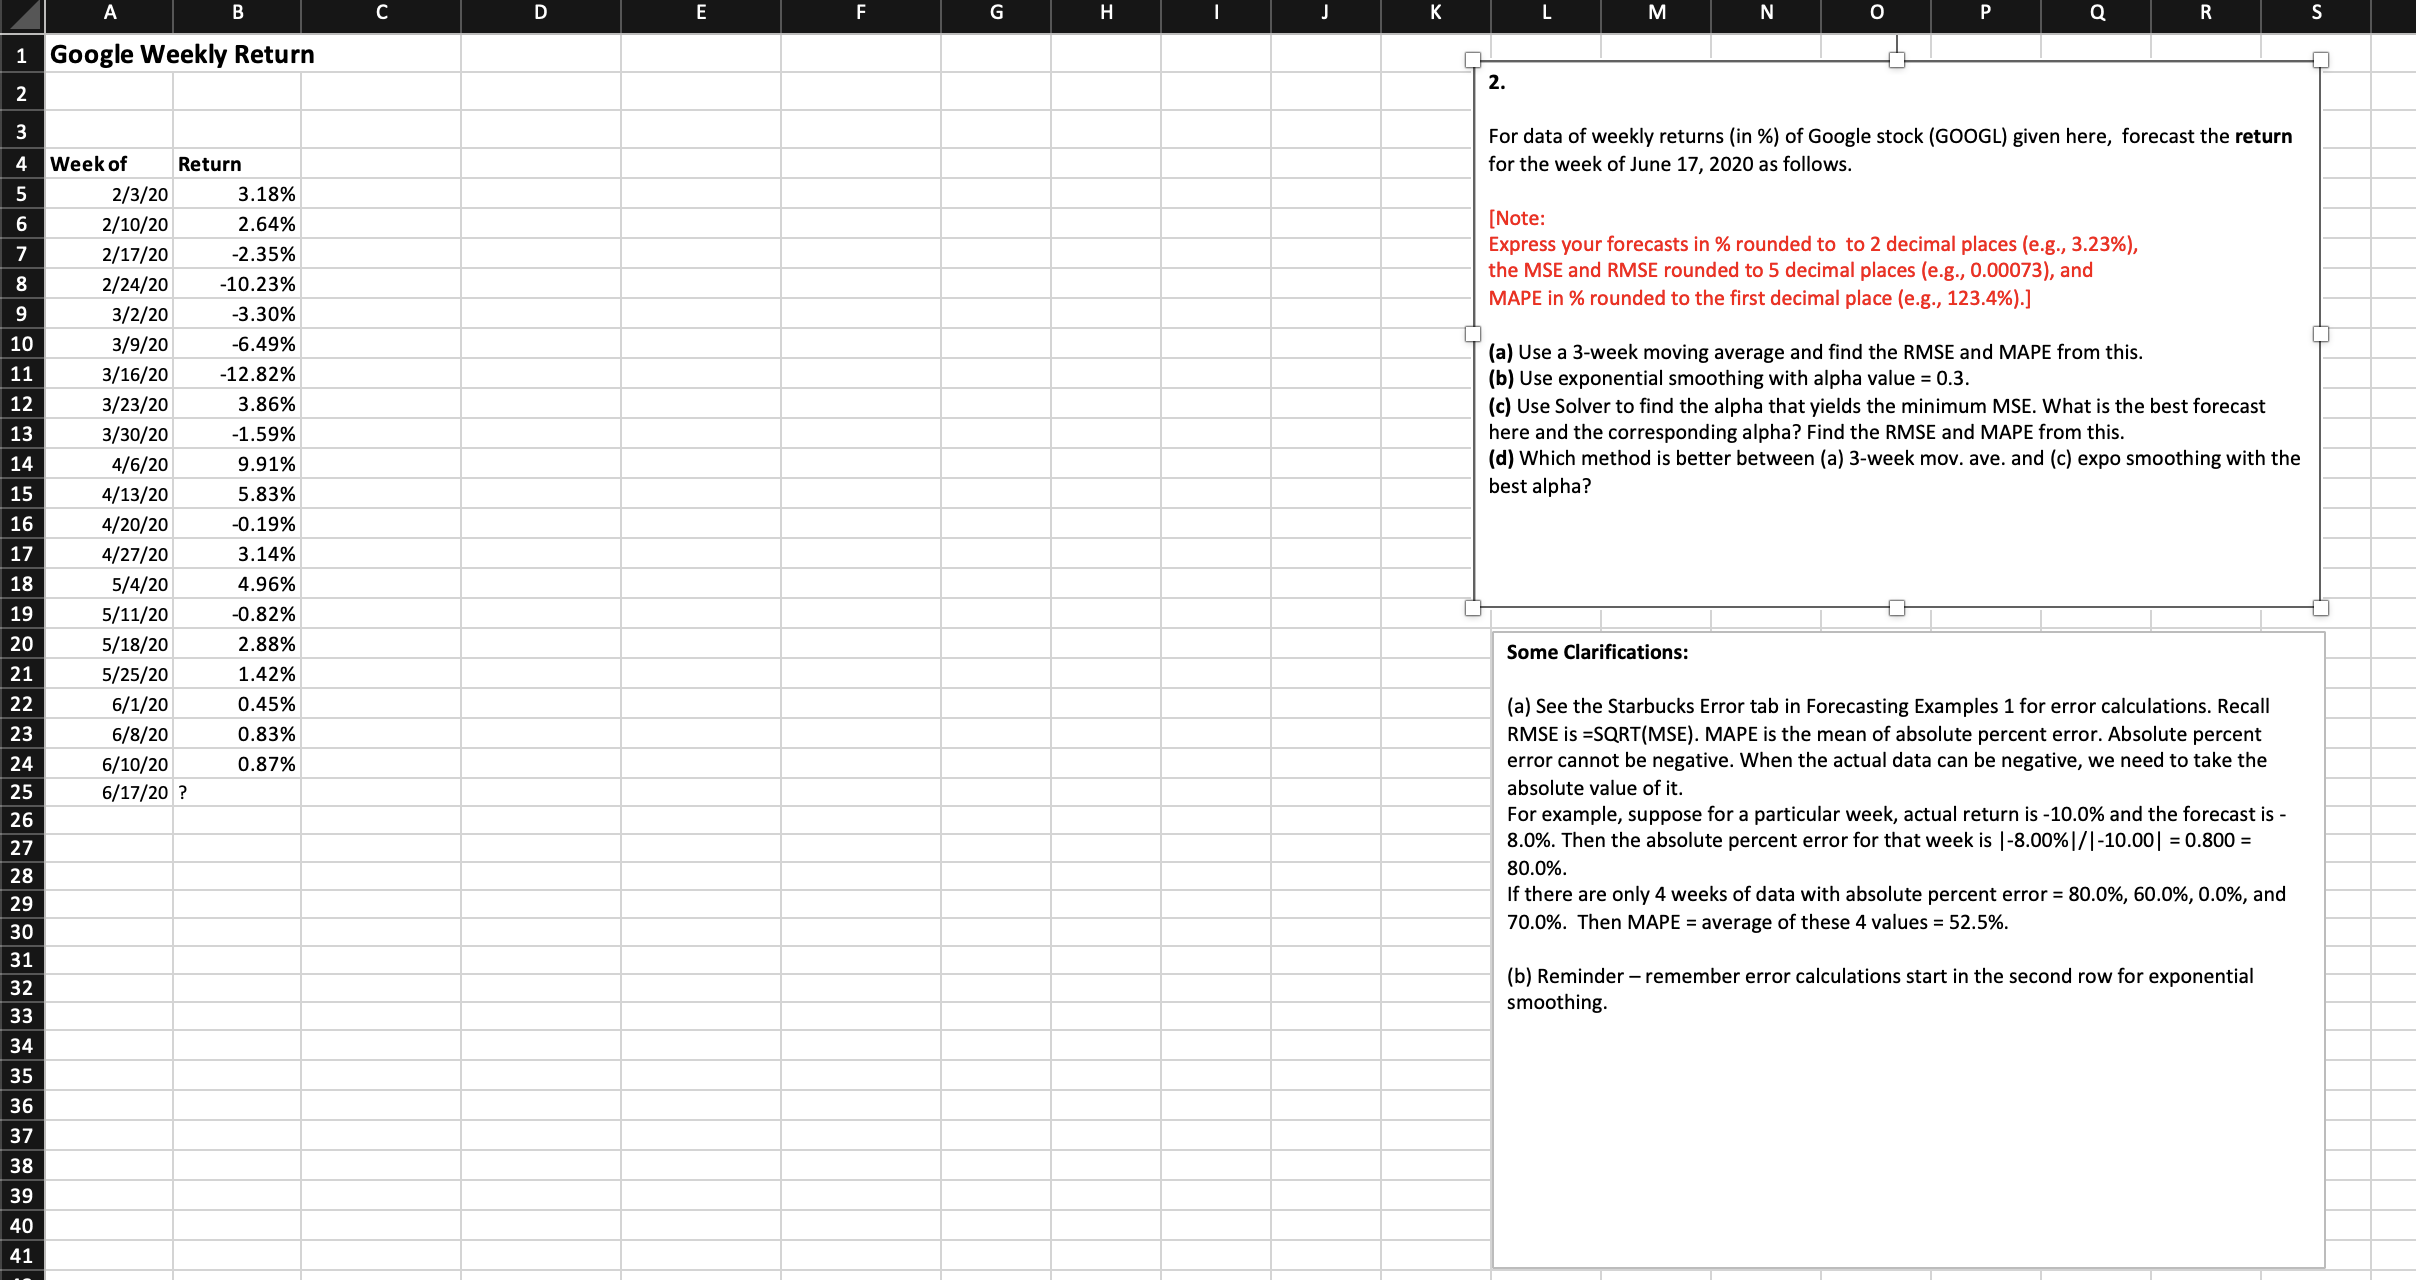
Google Weekly Return 2. For data of weekly returns (in \%) of Google stock (GOOGL) given here, forecast the return for the week of June 17,2020 as follows. [Note: Express your forecasts in \% rounded to to 2 decimal places (e.g., 3.23\%), the MSE and RMSE rounded to 5 decimal places (e.g., 0.00073 ), and MAPE in \% rounded to the first decimal place (e.g., 123.4\%).] (a) Use a 3-week moving average and find the RMSE and MAPE from this. (b) Use exponential smoothing with alpha value =0.3. (c) Use Solver to find the alpha that yields the minimum MSE. What is the best forecast here and the corresponding alpha? Find the RMSE and MAPE from this. (d) Which method is better between (a) 3-week mov. ave. and (c) expo smoothing with the best alpha? Some Clarifications: (a) See the Starbucks Error tab in Forecasting Examples 1 for error calculations. Recall RMSE is =SQRT(MSE). MAPE is the mean of absolute percent error. Absolute percent error cannot be negative. When the actual data can be negative, we need to take the absolute value of it. For example, suppose for a particular week, actual return is 10.0% and the forecast is 8.0%. Then the absolute percent error for that week is 8.00%/10.00=0.800= 80.0%. If there are only 4 weeks of data with absolute percent error =80.0%,60.0%,0.0%, and 70.0%. Then MAPE = average of these 4 values =52.5%. (b) Reminder - remember error calculations start in the second row for exponential smoothing
Step by Step Solution
There are 3 Steps involved in it

Get step-by-step solutions from verified subject matter experts