

Question: Got stuck on this question can you help me find the solution? Thank you. Chi-square Goodness of Fit Test and Test of Independence Distributions Concepts:
Got stuck on this question can you help me find the solution? Thank you.
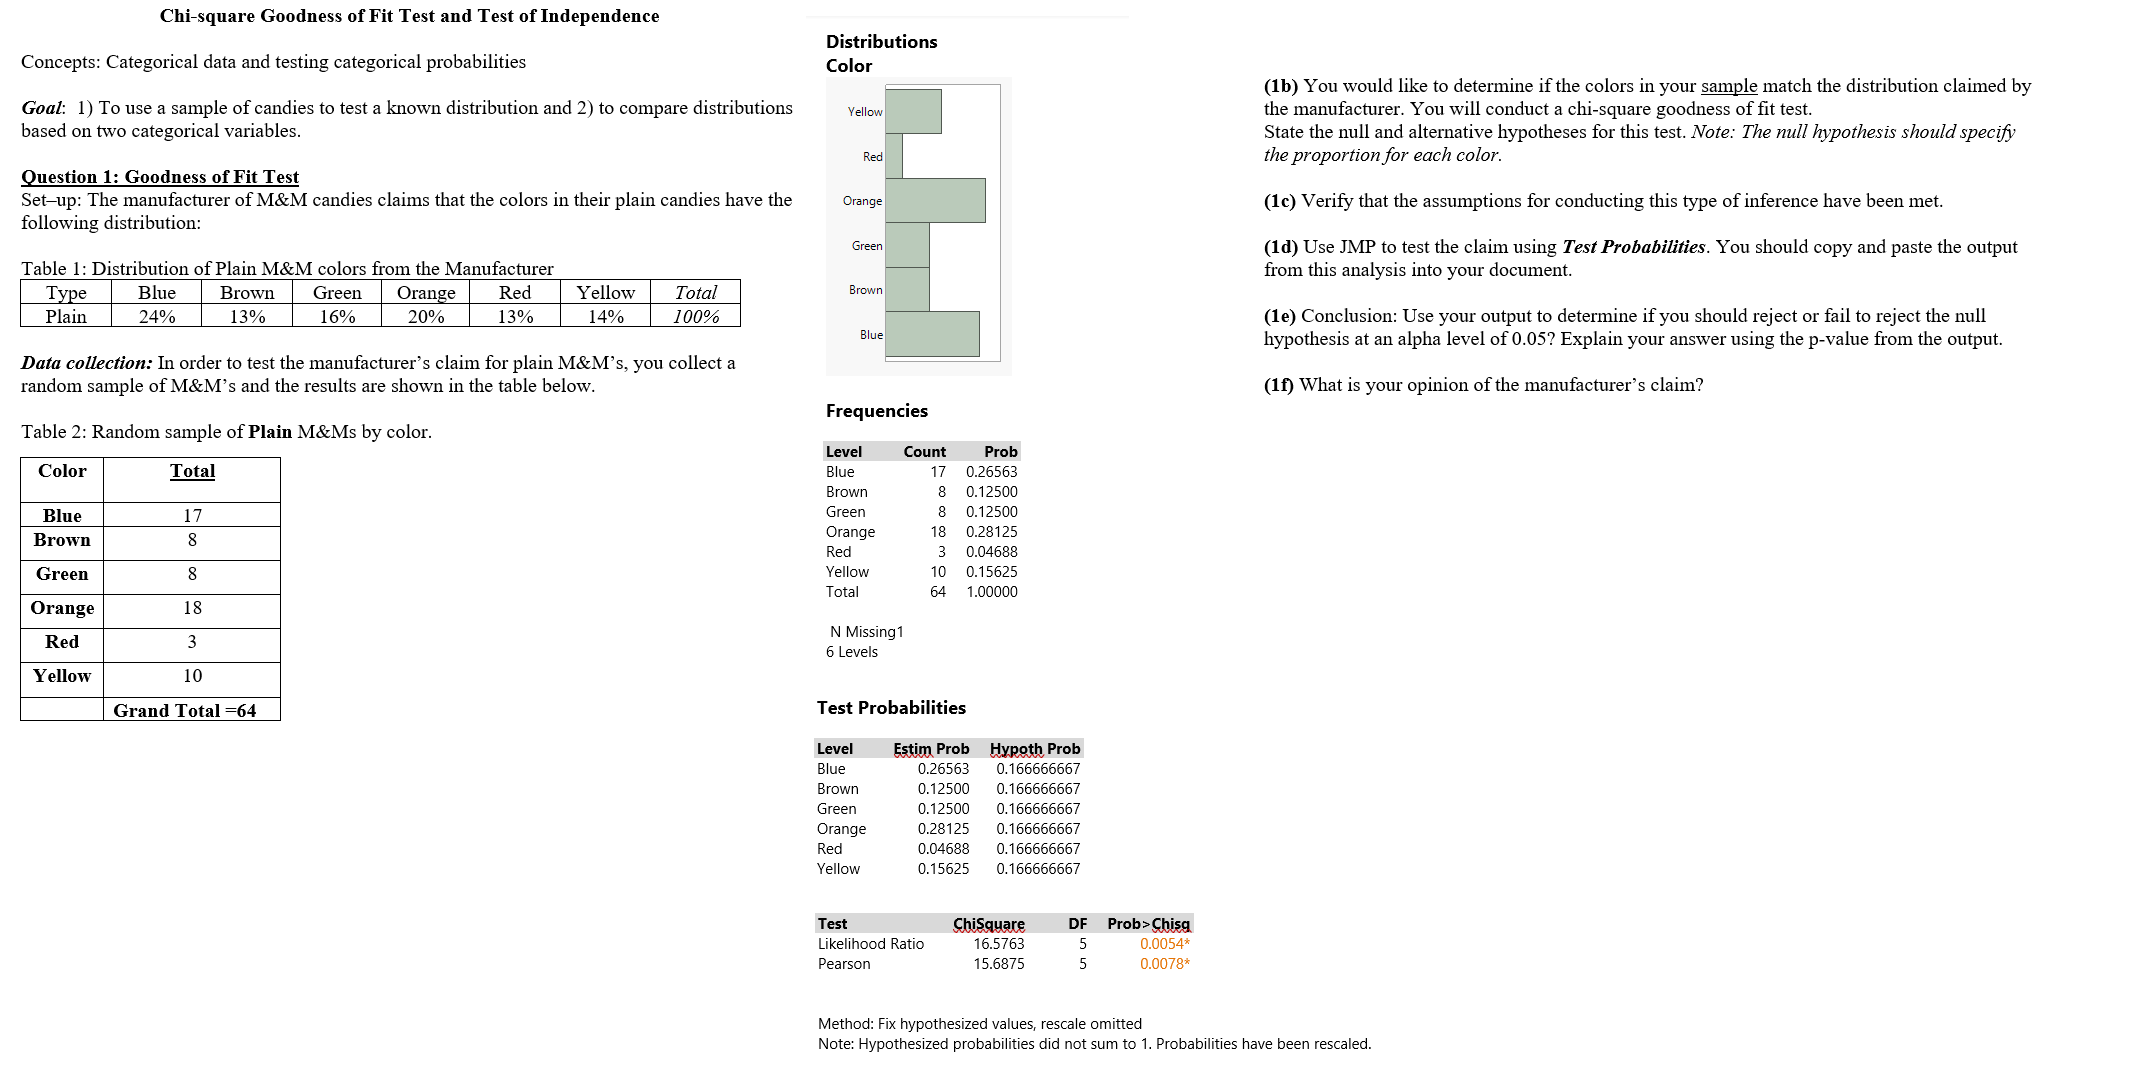
Chi-square Goodness of Fit Test and Test of Independence Distributions Concepts: Categorical data and testing categorical probabilities Color (1b) You would like to determine if the colors in your sample match the distribution claimed by Goal: 1) To use a sample of candies to test a known distribution and 2) to compare distributions Yellow the manufacturer. You will conduct a chi-square goodness of fit test. based on two categorical variables. State the null and alternative hypotheses for this test. Note: The null hypothesis should specify Red the proportion for each color. Question 1: Goodness of Fit Test Set-up: The manufacturer of M&M candies claims that the colors in their plain candies have the Orange (1c) Verify that the assumptions for conducting this type of inference have been met. following distribution: Green (1d) Use JMP to test the claim using Test Probabilities. You should copy and paste the output Table 1: Distribution of Plain M&M colors from the Manufacturer from this analysis into your document. Type Blue Brown Green Orange Red Yellow Total Brown Plain 24% 13% 16% 20% 13% 14% 100% (1e) Conclusion: Use your output to determine if you should reject or fail to reject the null Blue hypothesis at an alpha level of 0.05? Explain your answer using the p-value from the output. Data collection: In order to test the manufacturer's claim for plain M&M's, you collect a random sample of M&M's and the results are shown in the table below. (1f) What is your opinion of the manufacturer's claim? Frequencies Table 2: Random sample of Plain M&Ms by color. Level Count Prob Color Total Blue 17 0.26563 Brown 8 0.12500 Green 8 0.12500 Blue 17 Orange 18 0.28125 Brown 8 Red 3 0.04688 Green 8 Yellow 10 0.15625 Total 64 1.00000 Orange 18 N Missing 1 Red 3 6 Levels Yellow 10 Grand Total =64 Test Probabilities Level Estim Prob Hypoth Prob Blue 0.26563 0.166666667 Brown 0.12500 0.166666667 Green 0.12500 0.166666667 Orange 0.28125 0.166666667 Red 0.04688 0.166666667 Yellow 0.15625 0.166666667 Test ChiSquare DF Prob>Chisg Likelihood Ratio 16.5763 0.0054* Pearson 15.6875 0.0078* Method: Fix hypothesized values, rescale omitted Note: Hypothesized probabilities did not sum to 1. Probabilities have been rescaled
Step by Step Solution
There are 3 Steps involved in it

Get step-by-step solutions from verified subject matter experts