

Question: GPA 3.5 2.5 1.5 The scatterplot below displays the grade point averages (GPAs) and verbal SAT scores for a sample of 100 students at
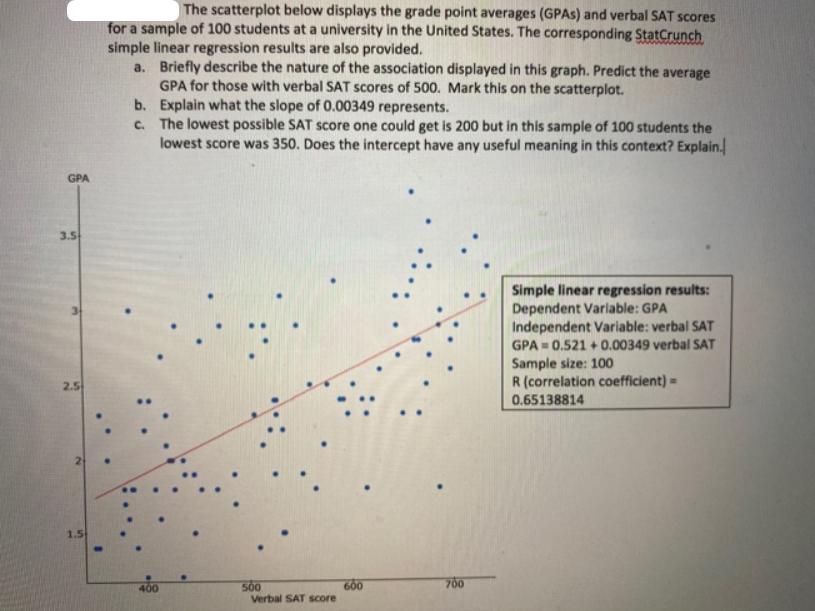
GPA 3.5 2.5 1.5 The scatterplot below displays the grade point averages (GPAs) and verbal SAT scores for a sample of 100 students at a university in the United States. The corresponding StatCrunch simple linear regression results are also provided. a. Briefly describe the nature of the association displayed in this graph. Predict the average GPA for those with verbal SAT scores of 500. Mark this on the scatterplot. Explain what the slope of 0.00349 represents. The lowest possible SAT score one could get is 200 but in this sample of 100 students the lowest score was 350. Does the intercept have any useful meaning in this context? Explain. b. c. 500 Verbal SAT score 600 700 Simple linear regression results: Dependent Variable: GPA Independent Variable: verbal SAT GPA=0.521 +0.00349 verbal SAT Sample size: 100 R (correlation coefficient) = 0.65138814
Step by Step Solution
There are 3 Steps involved in it
a Association and Prediction The scatterplot shows a positive linear association between verbal SAT ... View full answer

Get step-by-step solutions from verified subject matter experts