

Question: Grade Percentage Frequency A 9 9 B 19 30 C 44 40 D 19 32 F 9 5 A college requires that grades be distributed
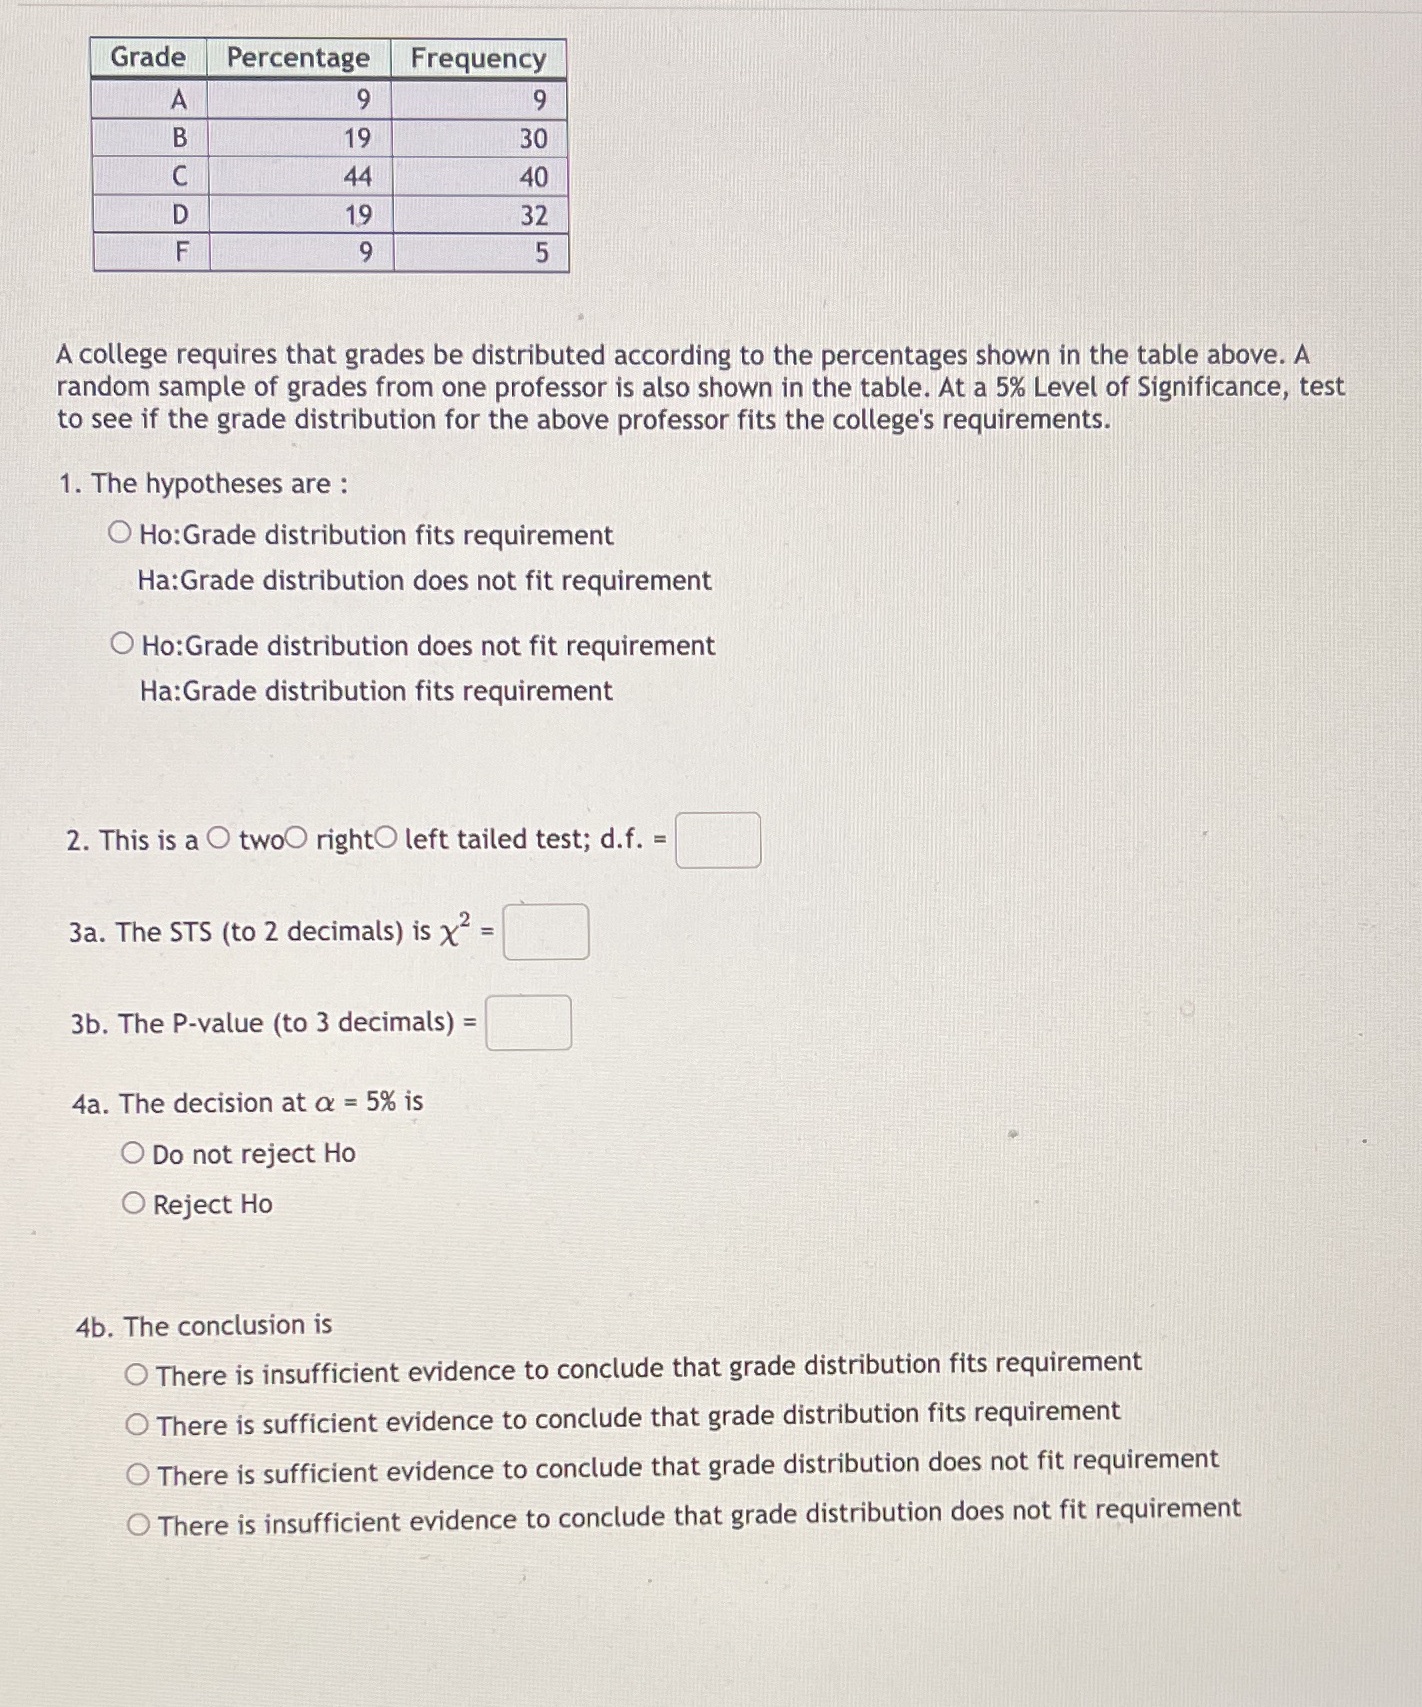
Grade Percentage Frequency A 9 9 B 19 30 C 44 40 D 19 32 F 9 5 A college requires that grades be distributed according to the percentages shown in the table above. A random sample of grades from one professor is also shown in the table. At a 5% Level of Significance, test to see if the grade distribution for the above professor fits the college's requirements. 1. The hypotheses are : O Ho:Grade distribution fits requirement Ha: Grade distribution does not fit requirement O Ho:Grade distribution does not fit requirement Ha: Grade distribution fits requirement 2. This is a O twoO right left tailed test; d.f. = 3a. The STS (to 2 decimals) is x2 = 3b. The P-value (to 3 decimals)= 4a. The decision at a = 5% is O Do not reject Ho O Reject Ho 4b. The conclusion is There is insufficient evidence to conclude that grade distribution fits requirement There is sufficient evidence to conclude that grade distribution fits requirement There is sufficient evidence to conclude that grade distribution does not fit requirement There is insufficient evidence to conclude that grade distribution does not fit requirement
Step by Step Solution
There are 3 Steps involved in it

Get step-by-step solutions from verified subject matter experts