

Question: GRADE & SCTION: PERFORMANCE TASK PART IL SUBJECT TEACHER: I. Construct the scatter plot of the given table using MS Excel or manually draw
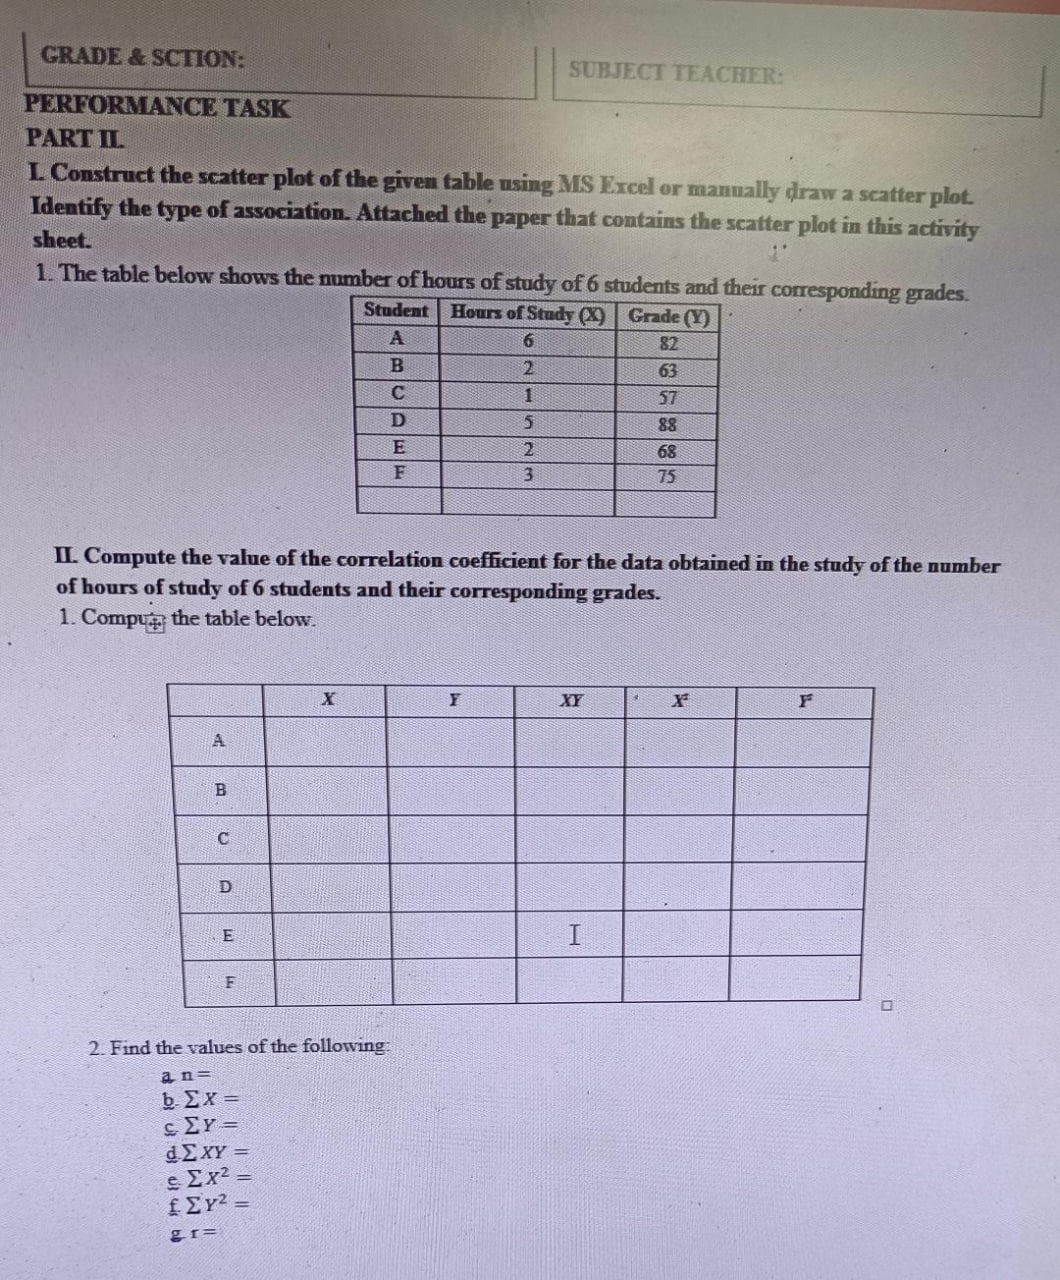
GRADE & SCTION: PERFORMANCE TASK PART IL SUBJECT TEACHER: I. Construct the scatter plot of the given table using MS Excel or manually draw a scatter plot. Identify the type of association. Attached the paper that contains the scatter plot in this activity sheet. 1' 1. The table below shows the number of hours of study of 6 students and their corresponding grades. Hours of Study (X) Grade (Y) Student A 6 82 B 2 63 C 1 57 D 5 88 E 2 68 F 3 75 II. Compute the value of the correlation coefficient for the data obtained in the study of the number of hours of study of 6 students and their corresponding grades. 1. Compu the table below. X Y XY r FF A B C D E F 2. Find the values of the following: an= b.x= cY = dxY e x fy= gr= I
Step by Step Solution
There are 3 Steps involved in it

Get step-by-step solutions from verified subject matter experts