

Question: Grade & Section Mr. De La Cruz The data below shows the heights in centimeters of 50 students in Grade 10 class of 163 182
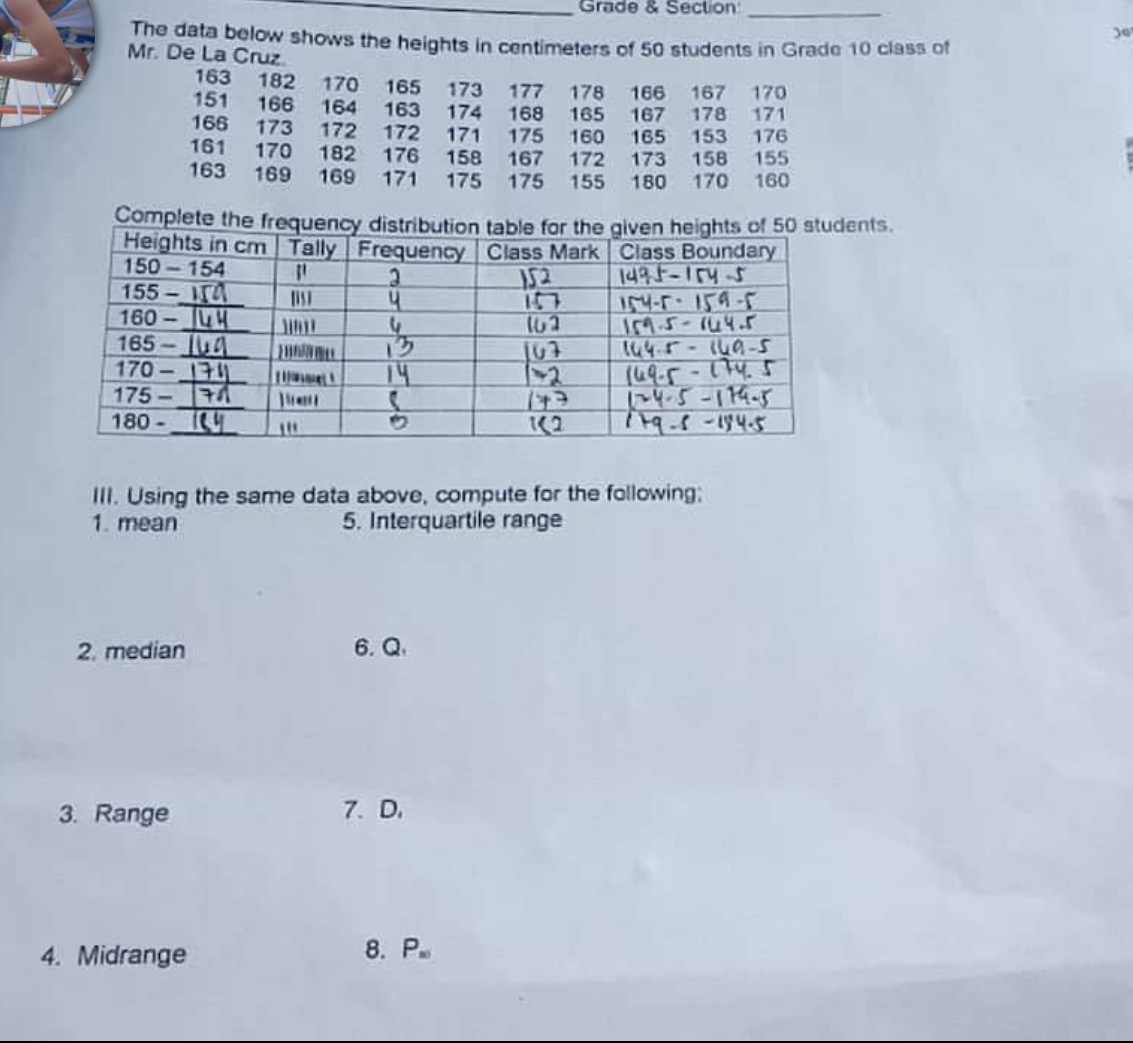
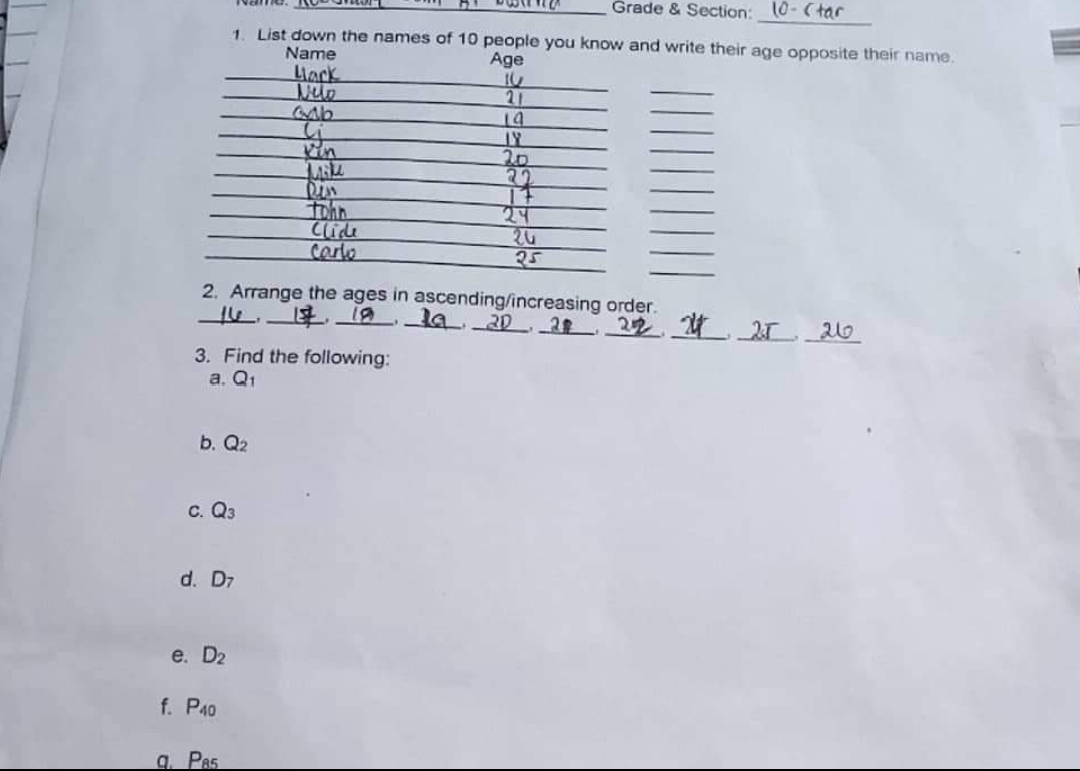


Grade & Section Mr. De La Cruz The data below shows the heights in centimeters of 50 students in Grade 10 class of 163 182 170 165 151 173 177 178 166 167 170 166 164 163 174 168 165 167 178 171 166 173 172 172 171 175 160 165 153 176 161 170 182 176 158 167 172 173 158 155 163 169 169 171 175 175 155 180 170 160 Complete the frequency distribution table for the given heights of 50 students, Heights in cm Tally Frequency Class Mark Class Boundary 150- 154 152 1474-154-5 155 - ITA 154-1. 159-5 160 - Ly 102 159.5- 1414.5 165 - 164 14 4-5 - 149-5 170 - 1741 14 1-2 149.5 - 174. 5 175 - 124-5 -179-5 180 - Ty Ill. Using the same data above, compute for the following: 1. mean 5. Interquartile range 2. median 6. Q. 3. Range 7. D. 4. Midrange 8. P.Grade & Section: 10- (tar 1. List down the names of 10 people you know and write their age opposite their name. Name Age Llack 21 Li 20 tohn 24 Clide carlo 25 2. Arrange the ages in ascending/increasing order. 3. Find the following: a. Q1 b. Q2 C. Q3 d. D7 e. D2 f. P40 a. Pas
Step by Step Solution
There are 3 Steps involved in it

Get step-by-step solutions from verified subject matter experts