

Question: Graded Activity - Drawing Graphs The data in the table below shows how the period of a pendulum depends upon the length of the pendulum.


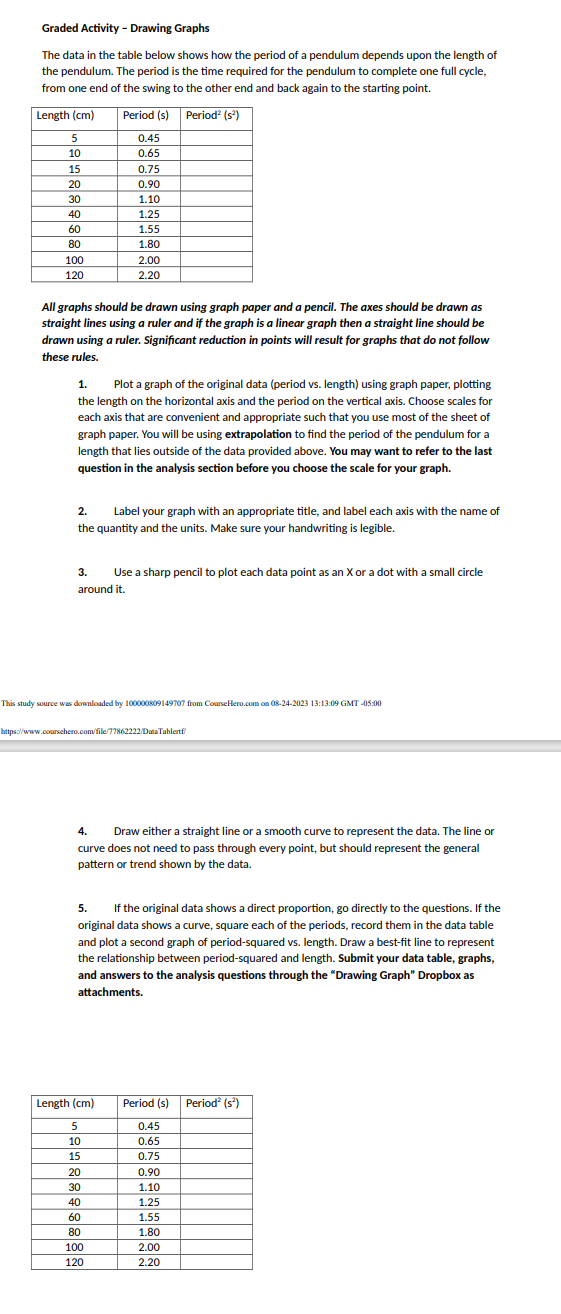
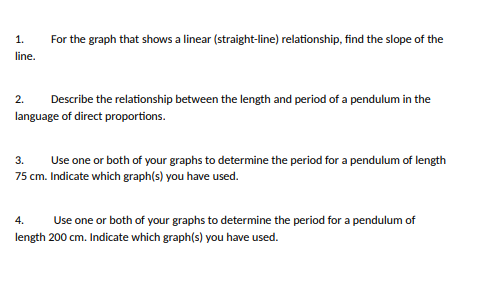
Graded Activity - Drawing Graphs The data in the table below shows how the period of a pendulum depends upon the length of the pendulum. The period is the time required for the pendulum to complete one full cycle, from one end of the swing to the other end and back again to the starting point. Length (cm) Period (s) Period (s') 5 0.45 10 0.65 15 0.75 20 0.90 30 1.10 40 1.25 60 1.55 80 1.80 100 2.00 120 2.20 All graphs should be drawn using graph paper and a pencil. The axes should be drawn as straight lines using a ruler and if the graph is a linear graph then a straight line should be drawn using a ruler. Significant reduction in points will result for graphs that do not follow these rules. 1. Plot a graph of the original data (period vs. length) using graph paper, plotting the length on the horizontal axis and the period on the vertical axis. Choose scales for each axis that are convenient and appropriate such that you use most of the sheet of graph paper. You will be using extrapolation to find the period of the pendulum for a length that lies outside of the data provided above. You may want to refer to the last question in the analysis section before you choose the scale for your graph. 2. Label your graph with an appropriate title, and label each axis with the name of the quantity and the units. Make sure your handwriting is legible. 3. Use a sharp pencil to plot each data point as an X or a dot with a small circle around it. This study source was downloaded by 100000809149707 from CourseHero.com on 08-24-2023 13:13:09 GMT -05:00 https:/www.coursehero.com/file/77862222/DataTabletf 4. Draw either a straight line or a smooth curve to represent the data. The line or curve does not need to pass through every point, but should represent the general pattern or trend shown by the data. 5. If the original data shows a direct proportion, go directly to the questions. If the original data shows a curve, square each of the periods, record them in the data table and plot a second graph of period-squared vs. length. Draw a best-fit line to represent the relationship between period-squared and length. Submit your data table, graphs, and answers to the analysis questions through the "Drawing Graph" Dropbox as attachments. Length (cm) Period (s) Period' (s') 5 0.45 10 ).65 15 0.75 20 0.90 30 1.10 40 1.25 60 1.55 80 1.80 100 2.00 120 2.201. For the graph that shows a linear (straight-line) relationship, find the slope of the line. 2. Describe the relationship between the length and period of a pendulum in the language of direct proportions. 3. Use one or both of your graphs to determine the period for a pendulum of length 75 cm. Indicate which graph(s) you have used. 4. Use one or both of your graphs to determine the period for a pendulum of length 200 cm. Indicate which graph(s) you have used
Step by Step Solution
There are 3 Steps involved in it

Get step-by-step solutions from verified subject matter experts