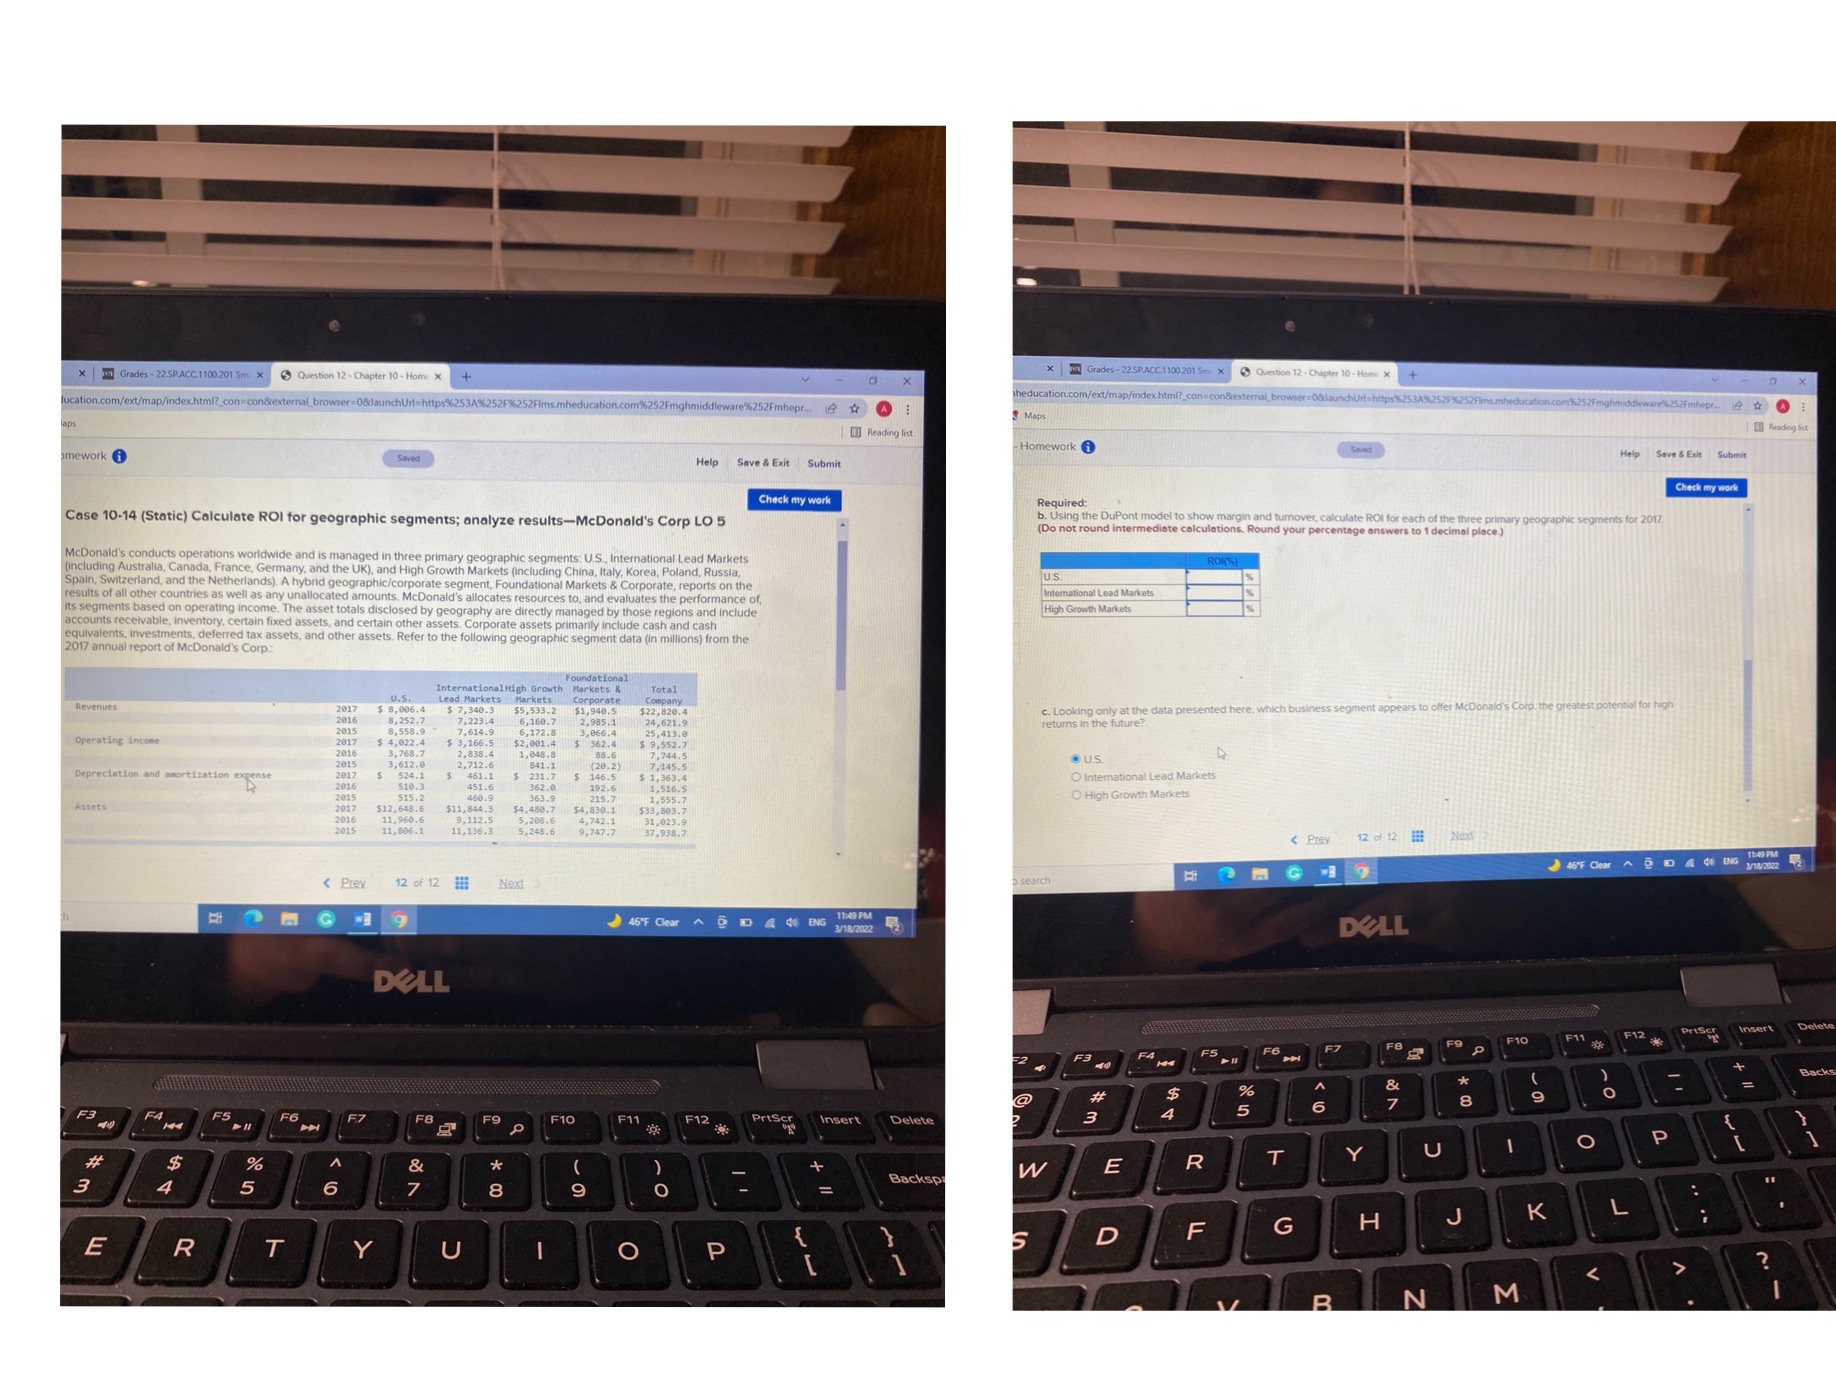
| Grades - 22.SP.ACC.1100.201 5m x Question 12 - Chapter 10- Home * + | wil Grades - 22.SP.ACC.1100.201 Sm x Question 12 - Chapter 10 - Home * + theducation.com/ext/map/index.html?_con=con&external_browser =>(8launchUrl =http:%2534%2525%252Films.mheducation ware%252Fmhepr_ # ucation.com/ext/map/index.html?_con= con&external_browser=08launchUrl=http:%253A252F252Flims.mheducation.com%252Fmghmiddleware%252Fmhepr... #@: Maps 1 0 Reading But [ Reading list -Homework Save & Exit Submit mework @ Saved Help Save & Exit Submit Check my work Check my work Required: b. Using the DuPont model to show margin and turnover, calculate ROI for each of the three primary geographic s s for 2017. Case 10-14 (Static) Calculate ROI for geographic segments; analyze results-Mcdonald's Corp LO 5 (Do not round intermediate calculations. Round your percentage answers to 1 decimal place.) Mcdonald's conducts operations worldwide and is managed in three primary geog geographic segments: U.S., International Lead Markets (including Australia, Canada, France, Germany, and the UK), and High Growth Markets (including China, Italy, Korea, Poland, Russia. US. . Switzerland, and the Netherlands). A hybrid geographic/corporate seam oundational Markets & Corporate, reports on the International Lead Markets results of all other countries as well as any unallocated amounts. Mcdonald's allocates resources to. hald's allocates resources to, and evaluates the performance of its segments based on operating income. The asset totals disclosed anaged by those regions and include High Growth Markets accounts receivable, inventory, certain fixed assets, and certain other assets. Corporate assets primarily include cash and cash equivalents, investments, deferred tax assets, and other assets. Refer to the following geographic segment data (in millions) from the 2017 annual report of Mcdonald's Corp.: anationalhigh Growth Corkersa Total $ 7, 340 1,948.5 c. Looking only at the data presented here, which b 2016 8,252.7 7,223 $5,533.2 $22,820.6 returns in the future? 3: 066. 25.413 Operating income 5 8: 022. 3, 768.7 362.4 . U.S. 3, 612.0 841.1 7,145.5 International Lead Markets Depreciation and amortization expense 524.1 146.5 510.3 362.0 363.9 192.6 O High Growth Markets Assets 12, 648 : 585-7 $11,6 $33, 803 1, 806. 823.9 11, 136 248.6 17 938:7