

Question: Grades Analysis In this project you will compute final grades and statistics and analyze the data. table [ [ , ] , [ ,
Grades Analysis
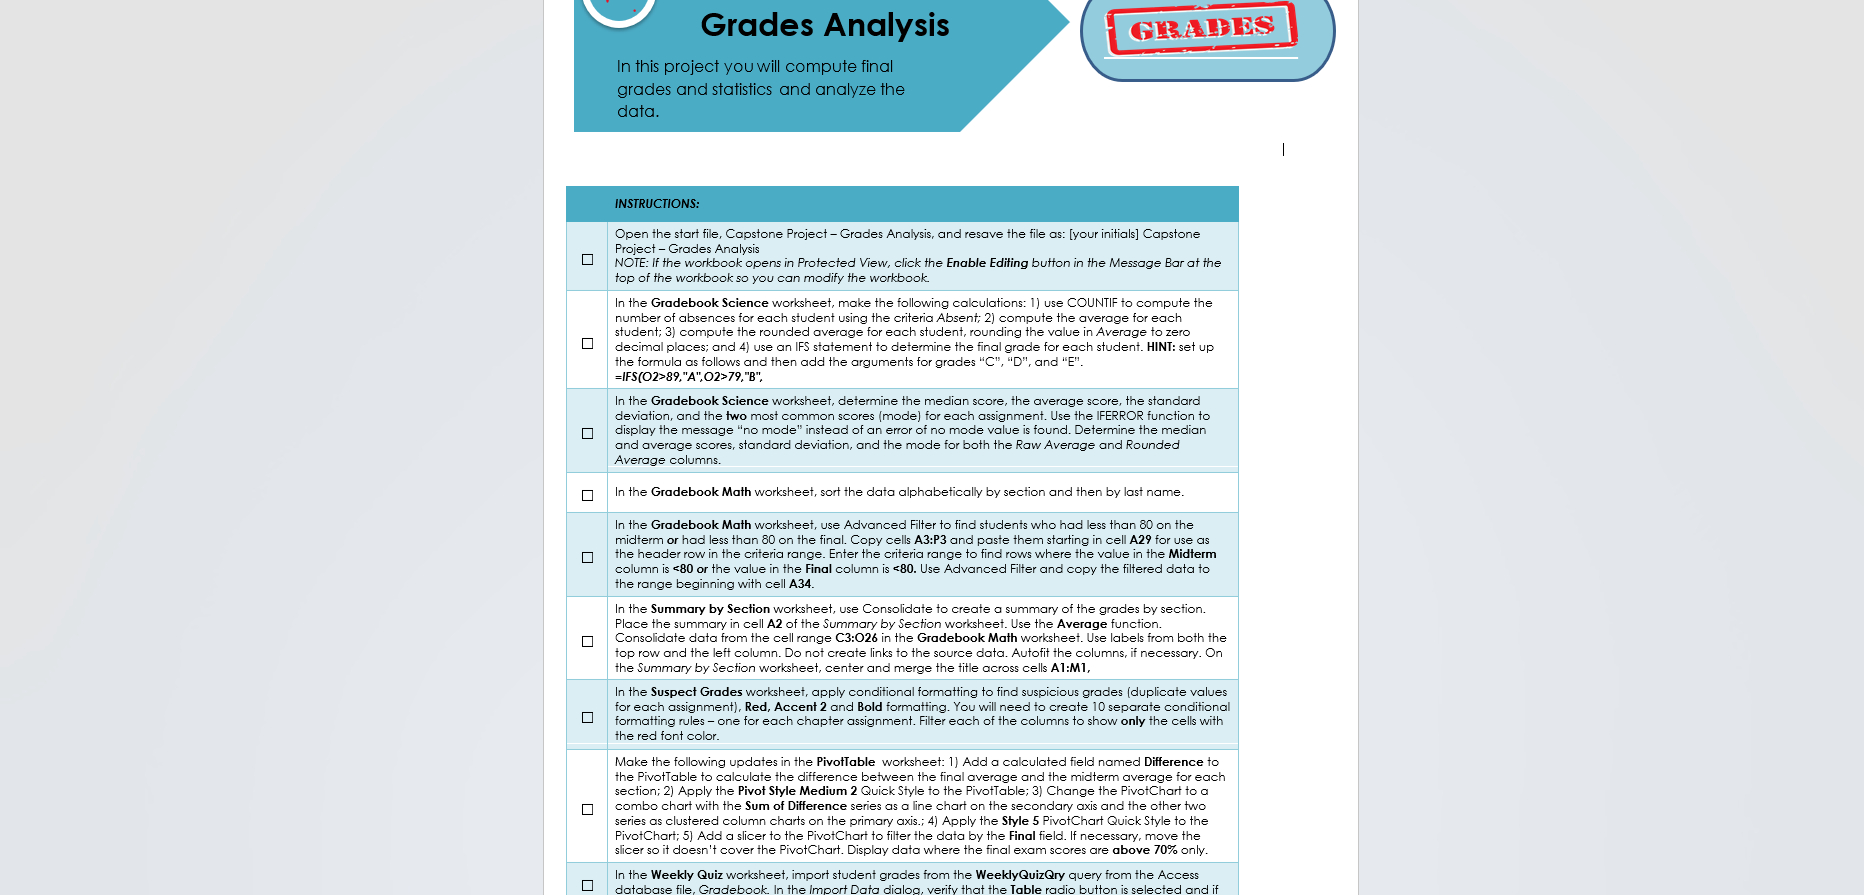
In this project you will compute final grades and statistics and analyze the data.
tabletableOpen the start file, Capstone Project Grades Analysis, and resave the file as: your initials CapstoneProject Grades AnalysisNOTE: If the workbook opens in Protected View, click the Enable Editing button in the Message Bar at thetop of the workbook so you can modify the workbook.tableIn the Gradebook Science worksheet, make the following calculations: use COUNTIF to compute thenumber of absences for each student using the criteria Absent; compute the average for eachstudent; compute the rounded average for each student, rounding the value in Average to zerodecimal places; and use an IFS statement to determine the final grade for each student. HINT: set upthe formula as follows and then add the arguments for grades C D and E IFS OA OB tableIn the Gradebook Science worksheet, determine the median score, the average score, the standarddeviation and the two most common scores mode for each assignment. Use the IFERROR function todisplay the message no mode" instead of an error of no mode value is found. Determine the medianand average scores, standard deviation, and the mode for both the Raw Average and RoundedAverage columns.In the Gradebook Math worksheet, sort the data alphabetically by section and then by last name.tableIn the Gradebook Math worksheet, use Advanced Filter to find students who had less than on themidterm or had less than on the final. Copy cells A:P and paste them starting in cell A for use asthe header row in the criteria range. Enter the criteria range to find rows where the value in the Midtermcolumn is epsi or the value in the Final column is Use Advanced Filter and copy the filtered data tothe range beginning with cell AtableIn the Summary by Section worksheet, use Consolidate to create a summary of the grades by section.Place the summary in cell A of the Summary by Section worksheet. Use the Average function.Consolidate data from the cell range C:O in the Gradebook Math worksheet. Use labels from both thetop row and the left column. Do not create links to the source data. Autofit the columns, if necessary. Onthe Summary by Section worksheet, center and merge the title across cells A:MtableIn the Suspect Grades worksheet, apply conditional formatting to find suspicious grades duplicate valuesfor each assignment Red, Accent and Bold formatting. You will need to create separate conditionalformatting rules one for each chapter assignment. Filter each of the columns to show only the cells withthe red font color.tableMake the following updates in the PivotIable worksheet: Add a calculated field named Difference tothe PivotTable to calculate the difference between the final average and the midterm average for eachsection; Apply the Pivot Style Medium Quick Style to the PivotTable; Change the PivotChart to acombo chart with the Sum of Difference series as a line chart on the secondary axis and the other twoseries as clustered column charts on the primary axis.; Apply the Style PivotChart Quick Style to thePivotChart; Add a slicer to the PivotChart to filter the data by the Final field. If necessary, move theslicer so it doesn't cover the PivotChart. Display data where the final exam scores are above only.ected
Step by Step Solution
There are 3 Steps involved in it
1 Expert Approved Answer
Step: 1 Unlock

Question Has Been Solved by an Expert!
Get step-by-step solutions from verified subject matter experts
Step: 2 Unlock
Step: 3 Unlock