

Question: Graph 1 Graph 2 5 Total units produced Total units produced Graph 3 Graph 4 $ Total units produced Total units produced Figure 21-1 Which
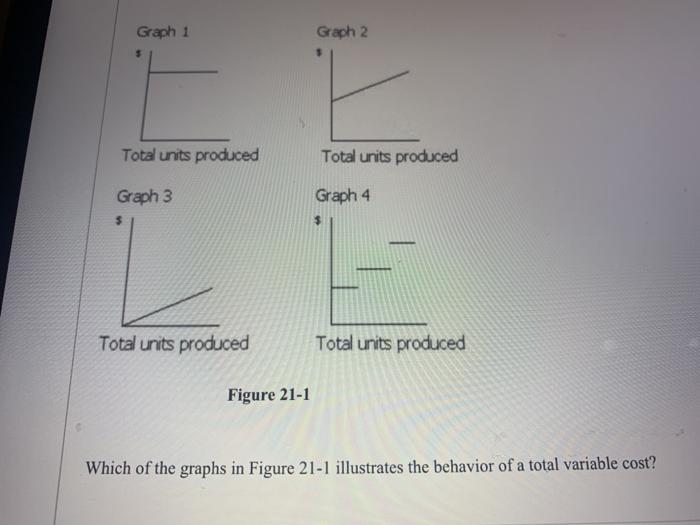
Graph 1 Graph 2 5 Total units produced Total units produced Graph 3 Graph 4 $ Total units produced Total units produced Figure 21-1 Which of the graphs in Figure 21-1 illustrates the behavior of a total variable cost
Step by Step Solution
There are 3 Steps involved in it
1 Expert Approved Answer
Step: 1 Unlock

Question Has Been Solved by an Expert!
Get step-by-step solutions from verified subject matter experts
Step: 2 Unlock
Step: 3 Unlock