

Question: Graph 1 Graph 2 Graph 3 Activity Base Activity Base 0 Activity Base Graph 4 Graph 5 Activity Base Activity Base FIGURE 20.2 For each
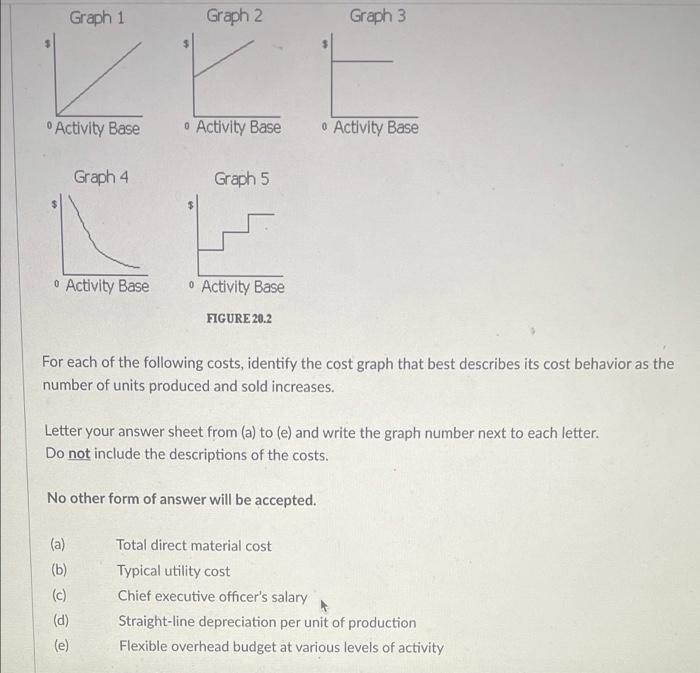
Graph 1 Graph 2 Graph 3 Activity Base Activity Base 0 Activity Base Graph 4 Graph 5 Activity Base Activity Base FIGURE 20.2 For each of the following costs, identify the cost graph that best describes its cost behavior as the number of units produced and sold increases. Letter your answer sheet from (a) to (e) and write the graph number next to each letter. Do not include the descriptions of the costs. No other form of answer will be accepted. (a) (b) (c) (d) (e) Total direct material cost Typical utility cost Chief executive officer's salary Straight-line depreciation per unit of production Flexible overhead budget at various levels of activity
Step by Step Solution
There are 3 Steps involved in it

Get step-by-step solutions from verified subject matter experts