

Question: Graph 1. Point q is marked on the horizontal axis. Point P is marked on the vertical axis. The graph shows 3 curves M C,
Graph 1. Point q is marked on the horizontal axis. Point P is marked on the vertical axis. The graph shows 3 curves M C, A T C, and A V C and a horizontal line labeled M R. The curve labeled M C starts at a point that is slightly below point P and near the vertical axis, goes down and to the right, reaches the minimum, goes up and to the right, and ends at the top right. The curve labeled A T C starts at the top left, goes down and to the right, reaches the minimum and intersects M C at a point, goes up and to the right, and ends at the top-right. The ending point of A T C is near the bottom right of M C. The curve labeled A V C starts at a point above (0, P), goes down and to the right, intersects M C at a point, goes up and to the right, and ends at a point near the bottom right of A T C. M R starts at (0, P), goes straight and to the right, passes through M C and A V C and ends at the right-center. Graph 2. Point Q is marked on the horizontal axis. Point P is marked on the vertical axis. A rising line labeled S intersects a falling line labeled D at (Q, P).
Refer to the diagrams, which pertain to a purely competitive firm producing output q and the industry in which it operates. Which of the following is correct?
A. The diagrams portray short-run equilibrium but not long-run equilibrium.
B. The diagrams portray both long-run and short-run equilibrium.
C. The diagrams portray long-run equilibrium but not short-run equilibrium.
D. The diagrams portray neither long-run nor short-run equilibrium.
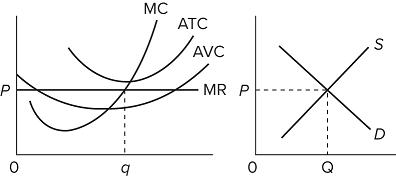
P 0 q MC ATC AVC MR P S D
Step by Step Solution
There are 3 Steps involved in it
Diagram 1 shows MC AVC and ATC curves which represent the firms cost structure in the sh... View full answer

Get step-by-step solutions from verified subject matter experts