

Question: GRAPH 1 to determine m table C which are #1,2,3,4, and 5. Draw a line of best fit for the data. Calculate the slope of

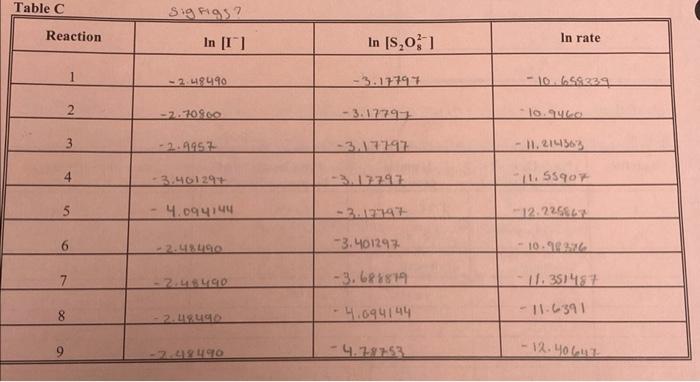
GRAPH 1 to determine m table C which are \#1,2,3,4, and 5. Draw a line of best fit for the data. Calculate the slope of the line of best fit by picking two points on the line where you can easily read the x and y values from your graph. Remember that slope =y/x With the [S2O82] being held constant, the natural logarithmic form of the equation becomes ln( rate )=mln[I]+c, where c=lnk+nln[S2Os2]. This shows that the slope of the line of best fit from the ln rate vs ln[I] plot for trials 1,2,3,4, and 5 will be equal to the value of m in the rate law for the reaction. Table C Sig figs
Step by Step Solution
There are 3 Steps involved in it
1 Expert Approved Answer
Step: 1 Unlock

Question Has Been Solved by an Expert!
Get step-by-step solutions from verified subject matter experts
Step: 2 Unlock
Step: 3 Unlock