

Question: GRAPH 2 to determine n Plot n rate against ln[S2O82] for the reactions where [I]is being held constant, which are #1,6, 7.8, and 9. Draw
![GRAPH 2 to determine n Plot n rate against ln[S2O82] for](https://dsd5zvtm8ll6.cloudfront.net/si.experts.images/questions/2024/09/66f8f5582a11b_76766f8f557bedf7.jpg)
![the reactions where [I]is being held constant, which are #1,6, 7.8, and](https://dsd5zvtm8ll6.cloudfront.net/si.experts.images/questions/2024/09/66f8f558a6013_76866f8f55854dc8.jpg)
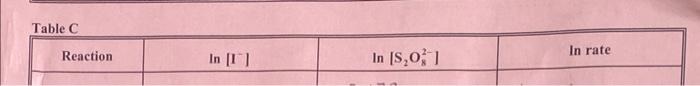
GRAPH 2 to determine n Plot n rate against ln[S2O82] for the reactions where [I]is being held constant, which are #1,6, 7.8, and 9. Draw a line of best fit for the data. Calculate the slope of the line. Similarly to the first graph, the slope of the line of best fit will be equal to n in the rate law for the reaction. Table C \begin{tabular}{|c|c|c|c||} \hline \hline Reaction & ln[I] & ln[S2O82] & ln rate \\ \hline \end{tabular}
Step by Step Solution
There are 3 Steps involved in it
1 Expert Approved Answer
Step: 1 Unlock

Question Has Been Solved by an Expert!
Get step-by-step solutions from verified subject matter experts
Step: 2 Unlock
Step: 3 Unlock