

Question: Graph 8.1 Data plotted in the graph appear in the table below. Obs # Day Demand Obs # Day Demand 1 Mon 33 12 Fri
Graph 8.1 Data plotted in the graph appear in the table below. Obs # Day Demand Obs # Day Demand 1 Mon 33 12 Fri 54 2 Tue 34 13 Sat 95 3 Wed 37 14 Sun 92 4 Thu 42 15 Mon 58 5 Fri 44 16 Tue 63 6 Sat 79 17 Wed 67 7 Sun 86 18 Thu 70 8 Mon 51 19 Fri 74 9 Tue 50 20 Sat 114 10 Wed 51 21 Sun 119 11 Thu 52 Refer to Graph 8.1. What is the average demand for the second period? Group of answer choices 63.57 50.71 82.5 93.5
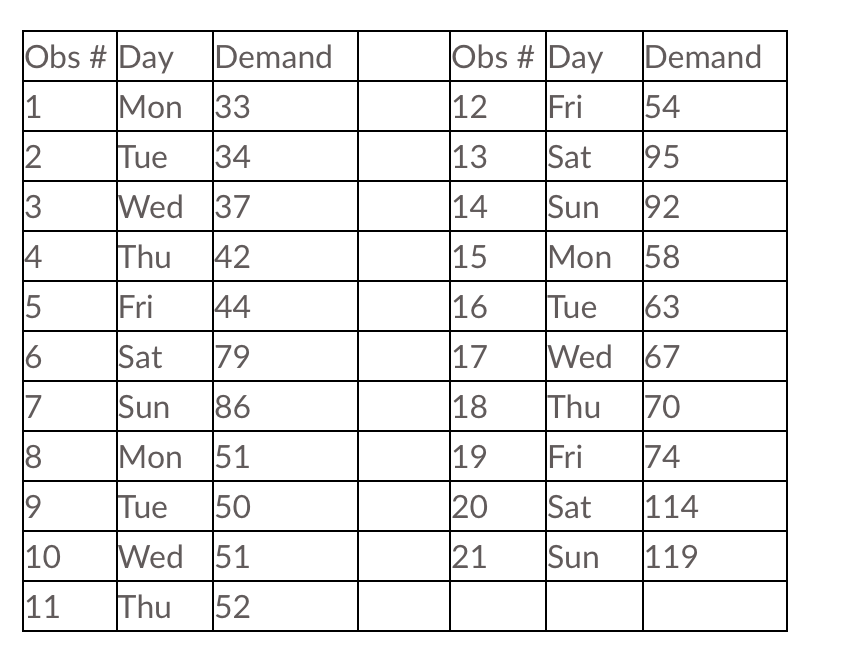
\begin{tabular}{|l|l|l|l|l|l|l|} \hline Obs \# & Day & Demand & & Obs \# & Day & Demand \\ \hline 1 & Mon & 33 & & 12 & Fri & 54 \\ \hline 2 & Tue & 34 & & 13 & Sat & 95 \\ \hline 3 & Wed & 37 & & 14 & Sun & 92 \\ \hline 4 & Thu & 42 & & 15 & Mon & 58 \\ \hline 5 & Fri & 44 & & 16 & Tue & 63 \\ \hline 6 & Sat & 79 & & 17 & Wed & 67 \\ \hline 7 & Sun & 86 & & 18 & Thu & 70 \\ \hline 8 & Mon & 51 & & 19 & Fri & 74 \\ \hline 9 & Tue & 50 & & 20 & Sat & 114 \\ \hline 10 & Wed & 51 & & 21 & Sun & 119 \\ \hline 11 & Thu & 52 & & & & \\ \hline \end{tabular}
Step by Step Solution
There are 3 Steps involved in it

Get step-by-step solutions from verified subject matter experts