

Question: GRAPH ANALYSIS Referring to the graph below, explain how: (a) An excess of supply might be created by government prices supports for wheat, and (b)
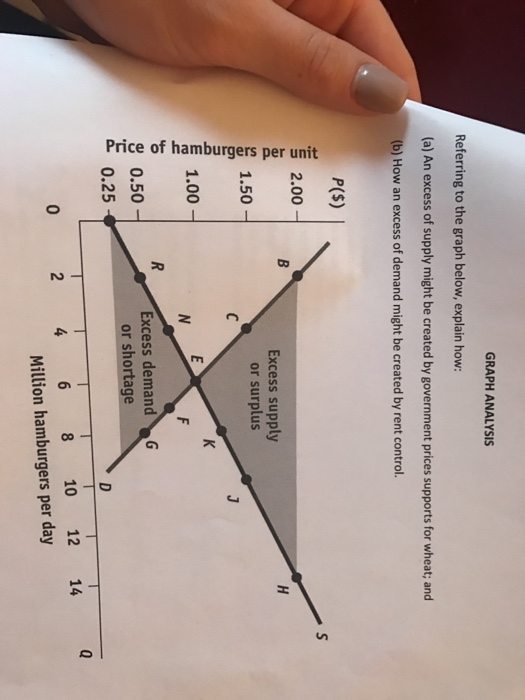
GRAPH ANALYSIS Referring to the graph below, explain how: (a) An excess of supply might be created by government prices supports for wheat, and (b) How an excess of demand might be created by rent control. 3 Excess supply or surplus ers .50 am ,00. Excess demand or shortage 10 12 14
Step by Step Solution
There are 3 Steps involved in it
1 Expert Approved Answer
Step: 1 Unlock

Question Has Been Solved by an Expert!
Get step-by-step solutions from verified subject matter experts
Step: 2 Unlock
Step: 3 Unlock