

Question: graph and also graph standard curve based on table and analyze results begin{tabular}{|c|c|} hline & ABSORBANCE hline BSA ONLY & 0.000 TEST TUBE
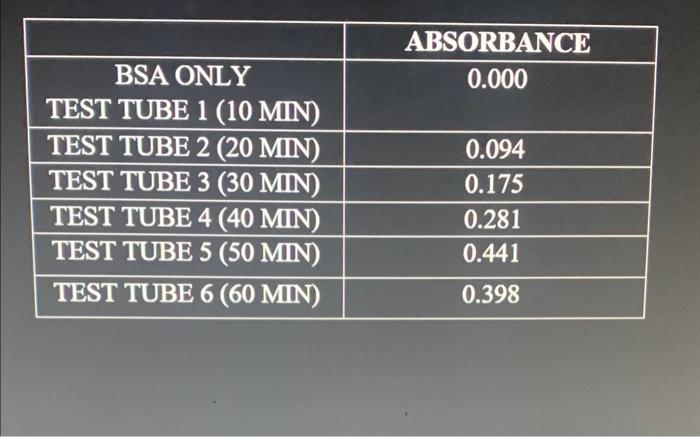
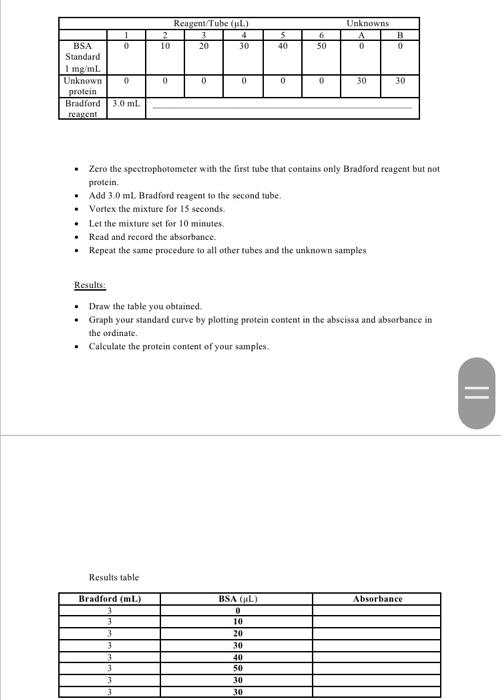
\begin{tabular}{|c|c|} \hline & ABSORBANCE \\ \hline BSA ONLY & 0.000 \\ TEST TUBE 1(10MIN) & \\ \hline TEST TUBE 2(20MIN) & 0.094 \\ \hline TEST TUBE 3(30MIN) & 0.175 \\ \hline TEST TUBE 4(40MIN) & 0.281 \\ \hline TEST TUBE 5(50MIN) & 0.441 \\ \hline TEST TUBE 6(60MIN) & 0.398 \\ \hline \end{tabular} - Zero the spectrophotometer with the first fube that contains only Bradford reagent but not protein. - Add 3.0mL. Bradford reageat to the second tube. - Vortex the mixture for 15 seconds. - Let the mixture set for 10 minutes. - Read and record the absorbance. - Repeat the same procedure to all other tubes and the unknown samples Results: - Draw the table you obtained. - Graph your standard curve by plotting protein content in the abscissa and absorbance in the ordinate. - Calculate the protean content of your samples. Results table \begin{tabular}{|c|c|} \hline & ABSORBANCE \\ \hline BSA ONLY & 0.000 \\ TEST TUBE 1(10MIN) & \\ \hline TEST TUBE 2(20MIN) & 0.094 \\ \hline TEST TUBE 3(30MIN) & 0.175 \\ \hline TEST TUBE 4(40MIN) & 0.281 \\ \hline TEST TUBE 5(50MIN) & 0.441 \\ \hline TEST TUBE 6(60MIN) & 0.398 \\ \hline \end{tabular} - Zero the spectrophotometer with the first fube that contains only Bradford reagent but not protein. - Add 3.0mL. Bradford reageat to the second tube. - Vortex the mixture for 15 seconds. - Let the mixture set for 10 minutes. - Read and record the absorbance. - Repeat the same procedure to all other tubes and the unknown samples Results: - Draw the table you obtained. - Graph your standard curve by plotting protein content in the abscissa and absorbance in the ordinate. - Calculate the protean content of your samples. Results table
Step by Step Solution
There are 3 Steps involved in it

Get step-by-step solutions from verified subject matter experts