

Question: Graph attachment provided below the Q&A link to assist you with the concept. Graph the data to get a clearer understanding of the negative
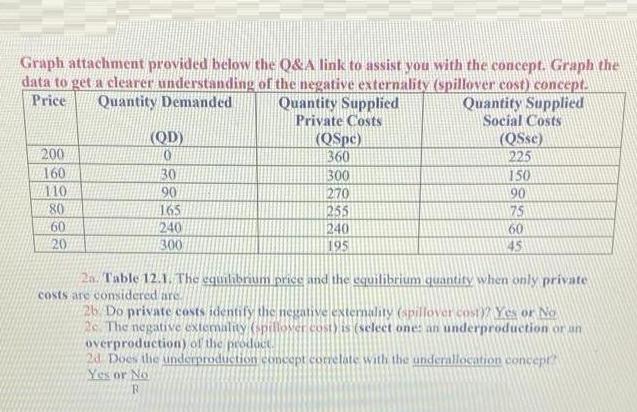

Graph attachment provided below the Q&A link to assist you with the concept. Graph the data to get a clearer understanding of the negative externality (spillover cost) concept. Price Quantity Demanded Quantity Supplied Private Costs Quantity Supplied Social Costs (QD) (QSse) (QSpc) 360 200 10 225 160 30 300 150 110 90 270 90 80 165 255 75 60 240 240 60 20 300 195 45 2a. Table 12.1. The equilibrium price and the equilibrium quantity when only private costs are considered are. 26. Do private costs identify the negative externality (spillover cost)? Yes or No 2. The negative externality (spillover cost) is (select one: an underproduction or an overproduction) of the product. 2d Does the underproduction concept correlate with the underallocation concept Yes or No R 2e Does the overproduction concept correlate with the overallocation concept? Yes or No
Step by Step Solution
3.33 Rating (156 Votes )
There are 3 Steps involved in it
2a In private equilibrium QD QSpc This holds true with Price 60 and Q 240 2b NO Private costs i... View full answer

Get step-by-step solutions from verified subject matter experts