

Question: Graph B: Position of a falling object (Power Function) Table 2. The position of the ball dropped from rest measured at different times Time t
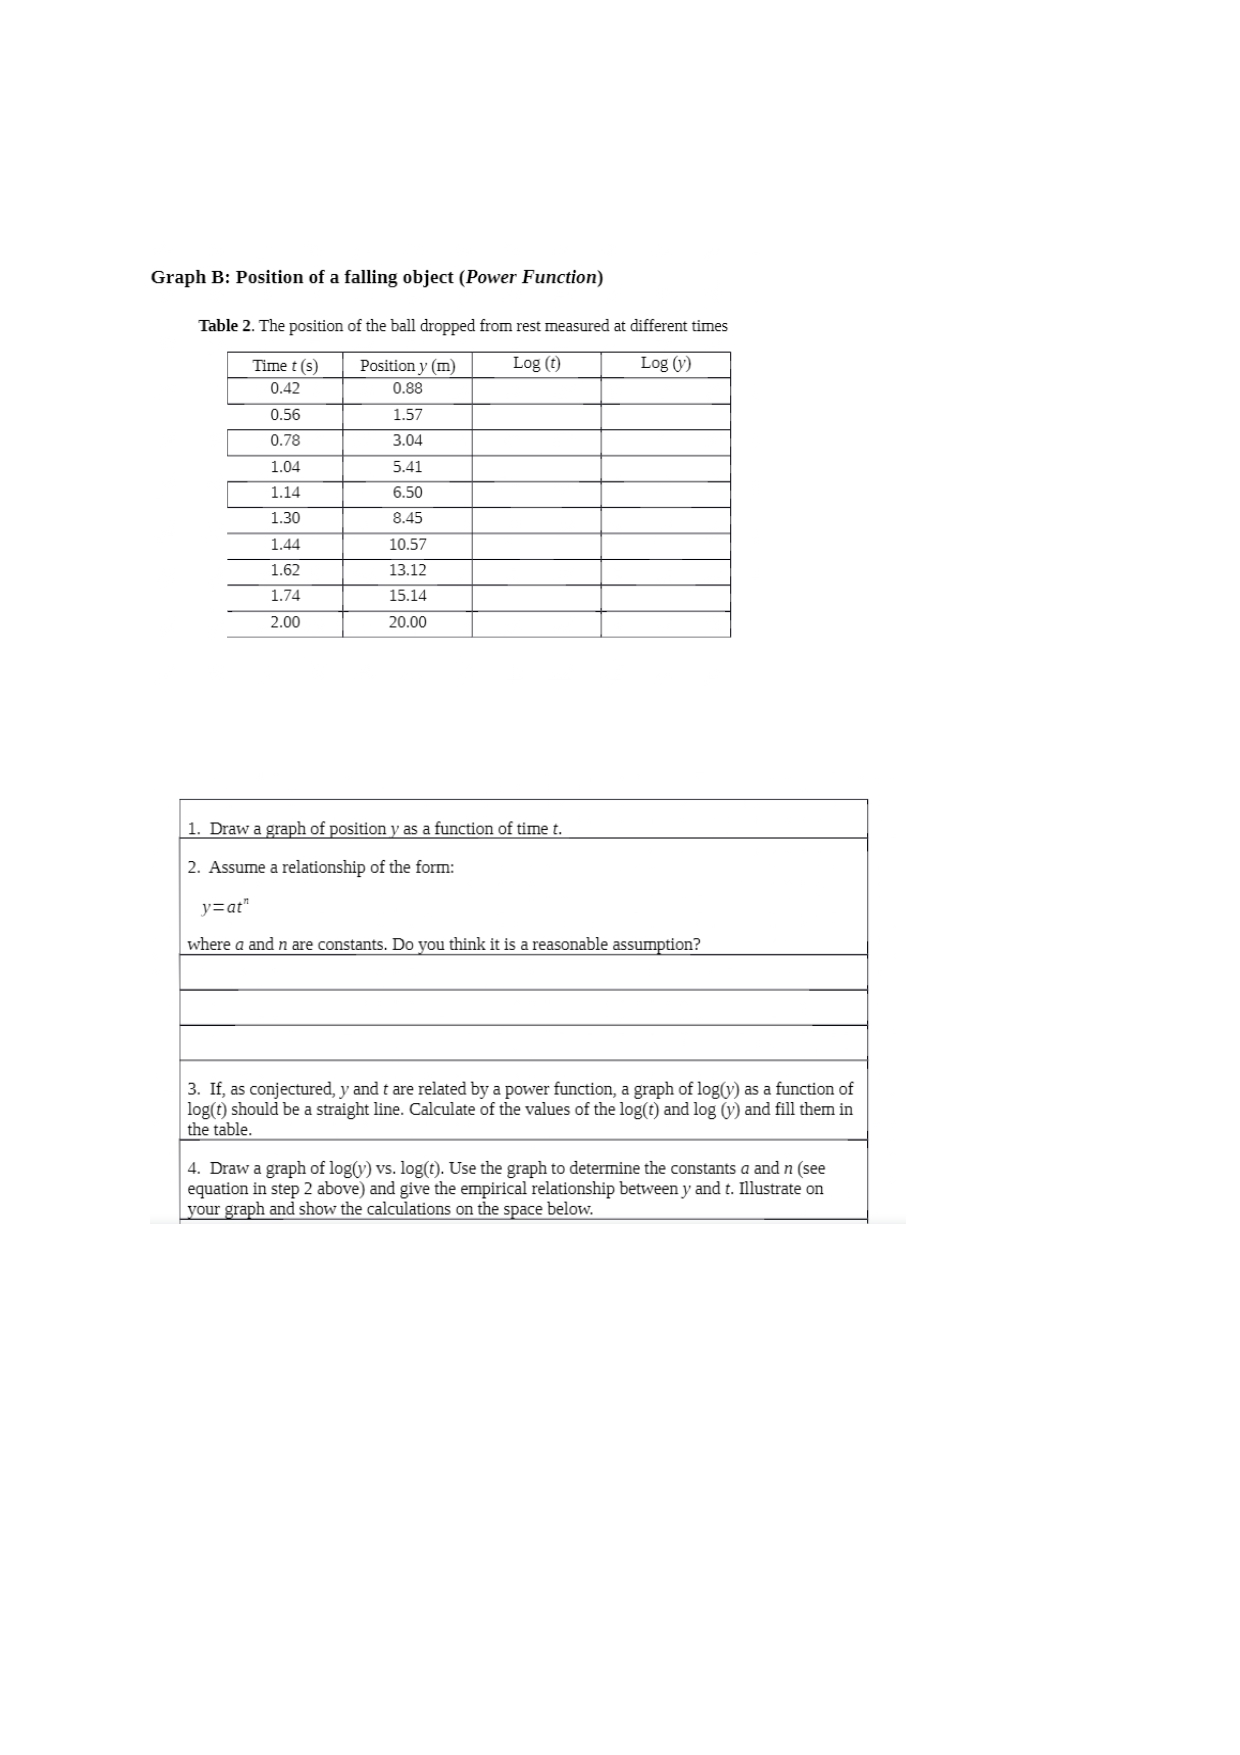
Graph B: Position of a falling object (Power Function) Table 2. The position of the ball dropped from rest measured at different times Time t (s) Position y (m) Log (t) Log (y) 0.42 0.88 0.56 1.5 0.78 3.04 1.04 5.41 1.14 6.50 1.30 8.45 1.44 10.57 1.62 13.12 1.74 15.14 2.00 20.00 1. Draw a graph of position y as a function of time t. 2. Assume a relationship of the form: y=at" where a and n are constants. Do you think it is a reasonable assumption? 3. If, as conjectured, y and t are related by a power function, a graph of log(y) as a function of log(t) should be a straight line. Calculate of the values of the log(t) and log (y) and fill them in the table 4. Draw a graph of log(y) vs. log(t). Use the graph to determine the constants a and n (see equation in step 2 above) and give the empirical relationship between y and t. Illustrate on your graph and show the calculations on the space below
Step by Step Solution
There are 3 Steps involved in it

Get step-by-step solutions from verified subject matter experts