

Question: Graph each of these three data sets separately ( line graph ) and describe what features appear in the data. Write yes or no in
Graph each of these three data sets separatelyline graph and describe what features appear in the data.
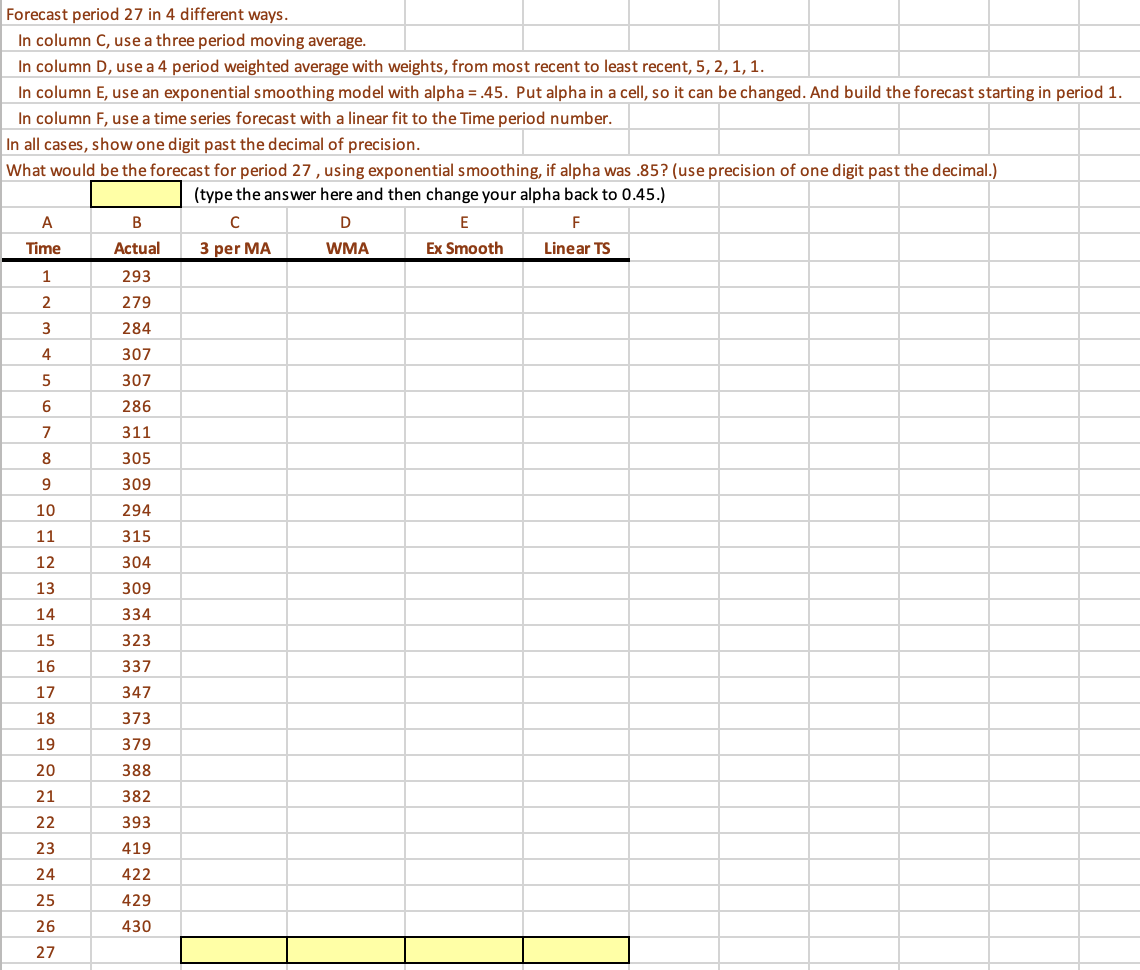
Write yes or no in each one of these boxes. Sometimes, it might be hard to distinguish between two options. Use judgement. Forecast period in different ways.
In column C use a three period moving average.
In column D use a period weighted average with weights, from most recent to least recent,
In column E use an exponential smoothing model with alpha Put alpha in a cell, so it can be changed. And build the forecast starting in period
In column F use a time series forecast with a linear fit to the Time period number.
In all cases, show one digit past the decimal of precision.
What would be the forecast for period using exponential smoothing, if alpha was use precision of one digit past the decimal.
Step by Step Solution
There are 3 Steps involved in it
1 Expert Approved Answer
Step: 1 Unlock

Question Has Been Solved by an Expert!
Get step-by-step solutions from verified subject matter experts
Step: 2 Unlock
Step: 3 Unlock