

Question: GRAPH HELP I HAVE DONE EVERYTHING ELSE BUT I DONT THINK THE GRAPH IS RIGHT PLEASE DEAR GOD HELP ME Consider a stock which is
GRAPH HELP
I HAVE DONE EVERYTHING ELSE BUT I DONT THINK THE GRAPH IS RIGHT PLEASE DEAR GOD HELP ME
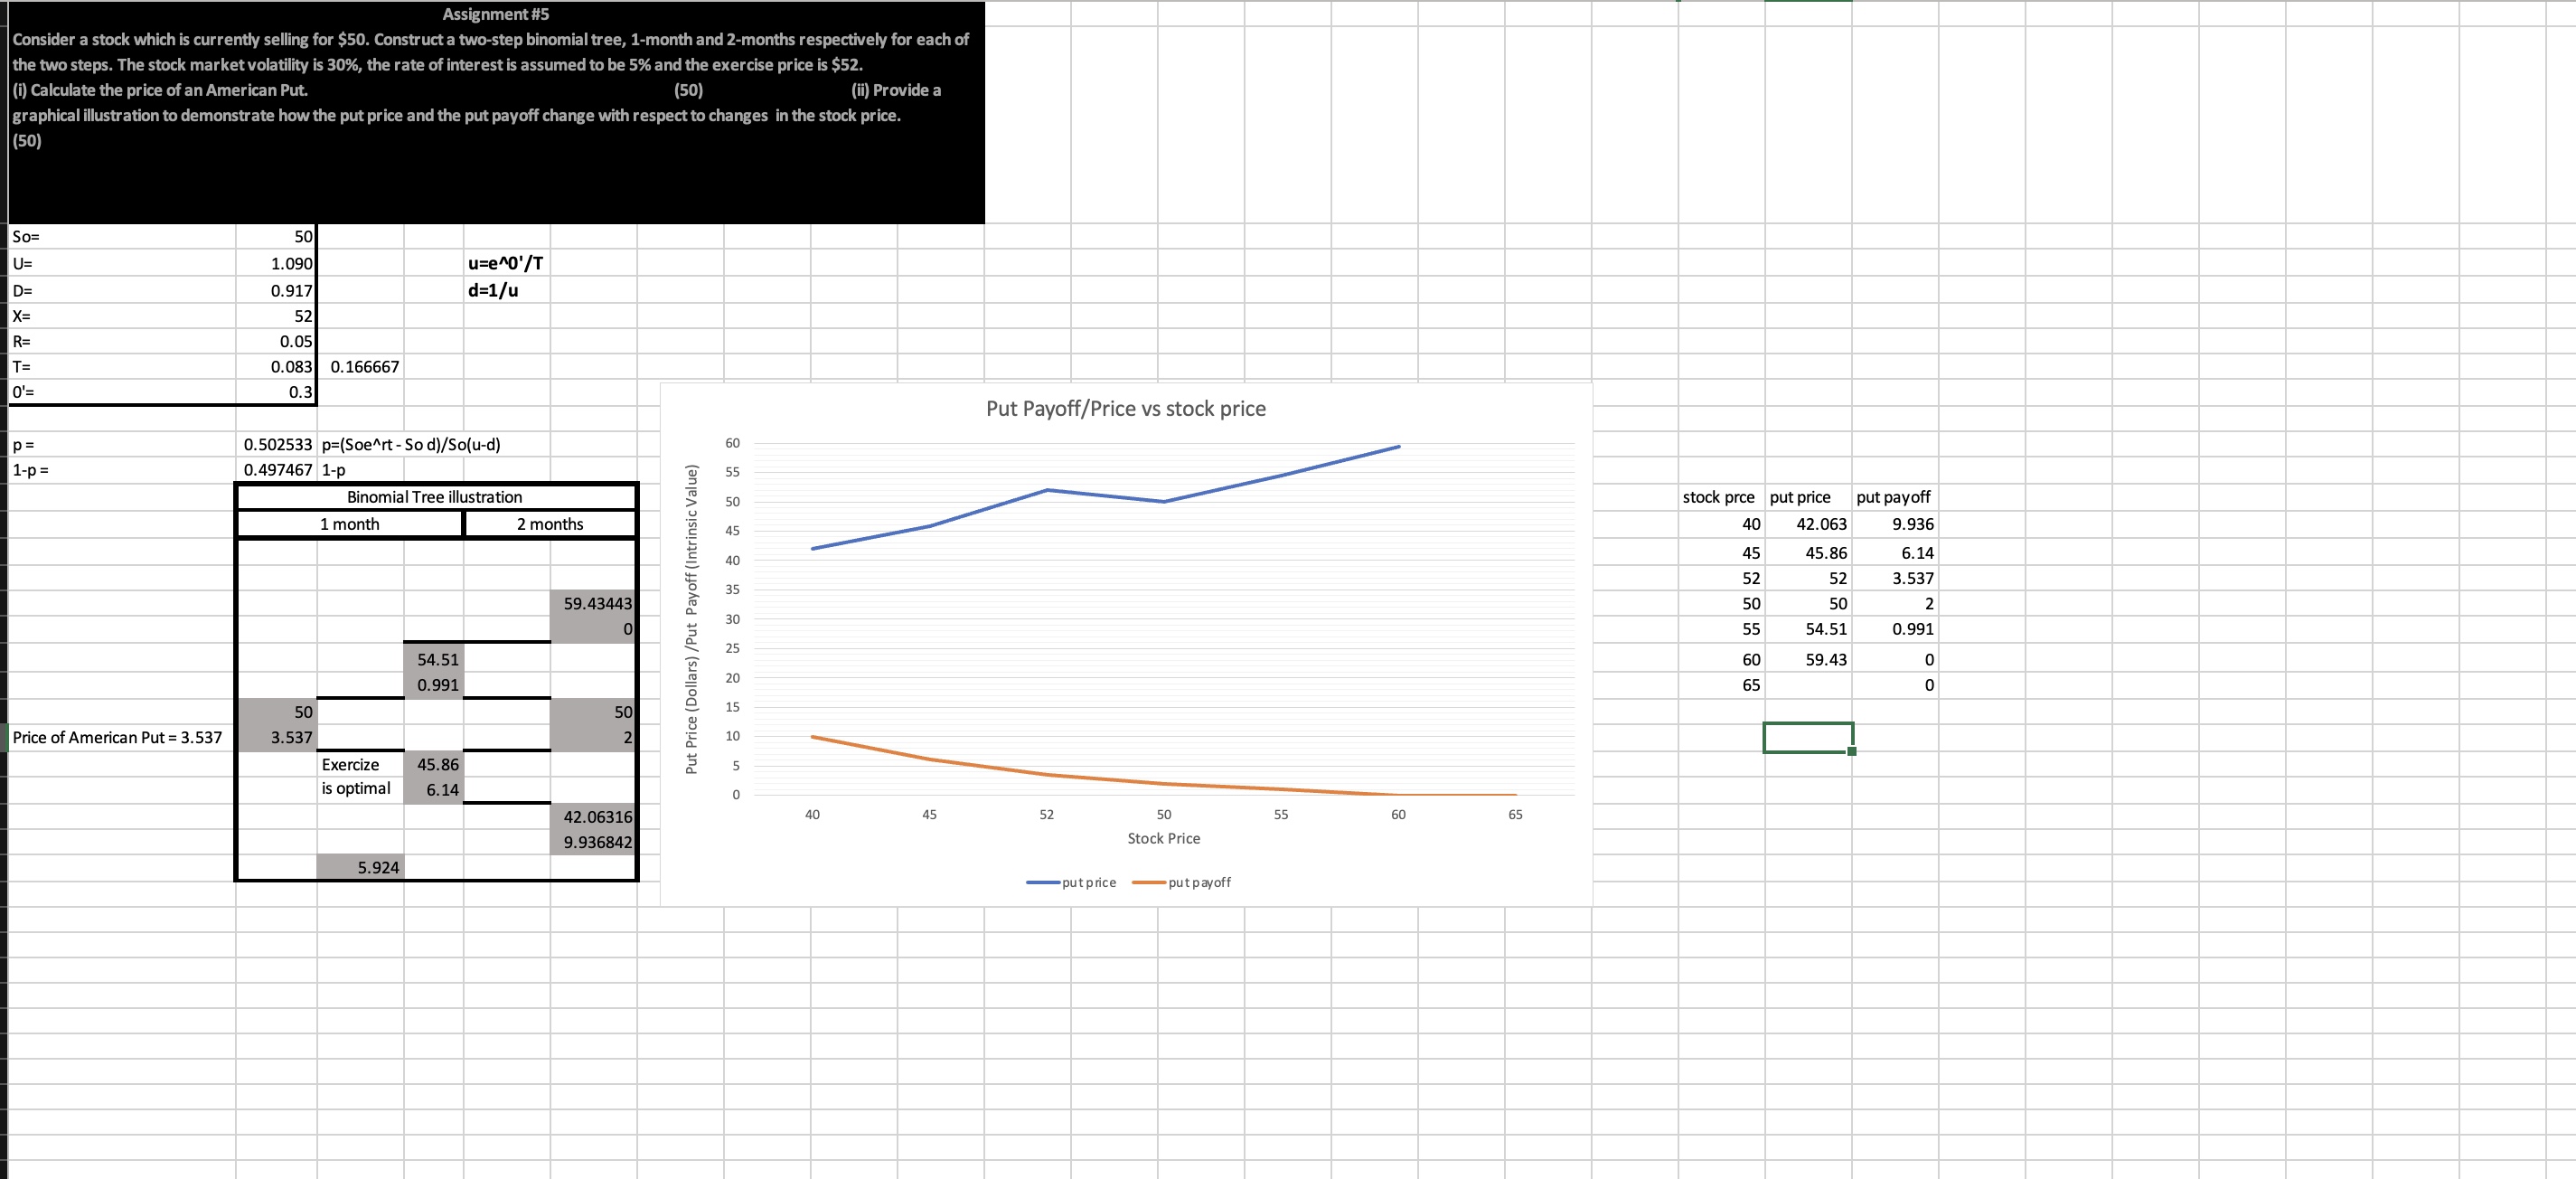
Consider a stock which is currently selling for $ Construct a twostep binomial tree, month and months respectively for each of the two steps. The stock market volatility is the rate of interest is assumed to be and the exercise price is $i Calculate the price of an American Put. ii Provide a graphical illustration to demonstrate how the put price and the put payoff change with respect to changes in the stock price. So U ueT D du X R T p pSoert So dSoudp p Binomial Tree illustration month months Price of American Put Exercize is optimal
Step by Step Solution
There are 3 Steps involved in it
1 Expert Approved Answer
Step: 1 Unlock

Question Has Been Solved by an Expert!
Get step-by-step solutions from verified subject matter experts
Step: 2 Unlock
Step: 3 Unlock