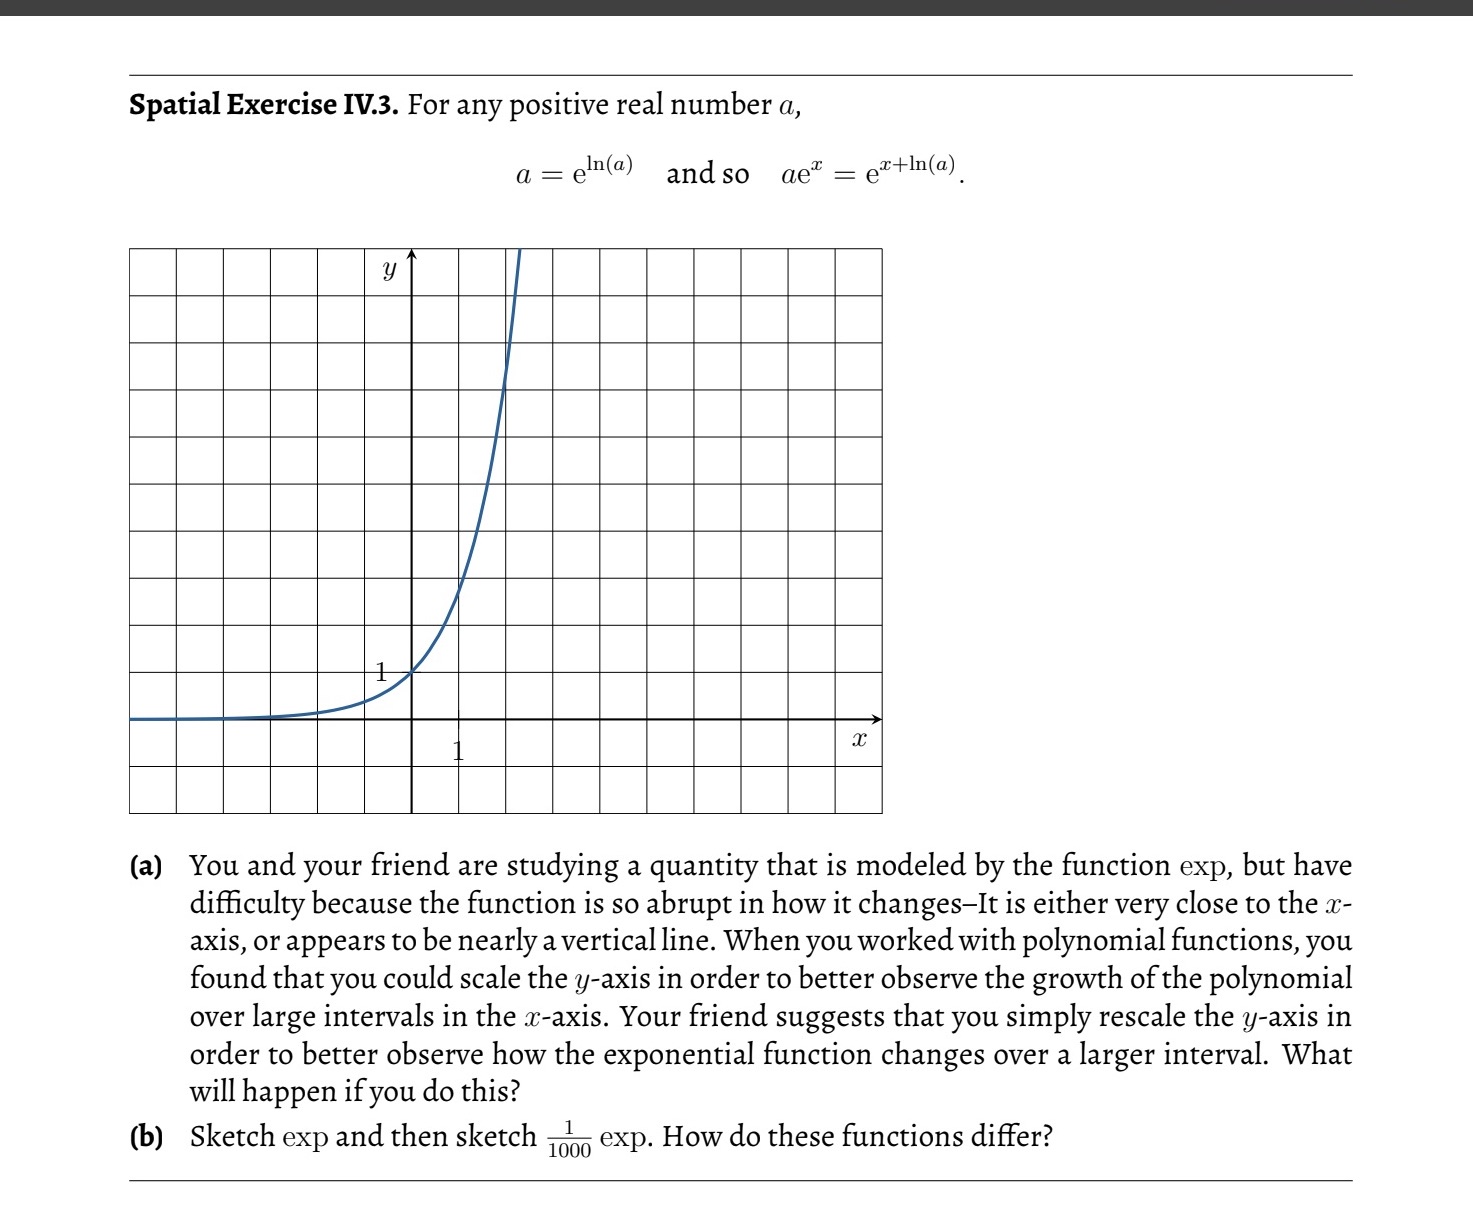
Question: Graph if needed Spatial Exercise IV.3. For any positive real number q, andso ae = e*tIn(@) (@) You and your friend are studying a quantity

Graph if needed

Graph if needed Spatial Exercise IV.3. For any
Spatial Exercise IV.3. For any positive real number q, andso ae = e*tIn(@) (@) You and your friend are studying a quantity that is modeled by the function exp, but have difficulty because the function is so abrupt in how it changes-It is either very close to the z- axis, or appears to be nearly a vertical line. When you worked with polynomial functions, you found that you could scale the y-axis in order to better observe the growth of the polynomial over large intervals in the z-axis. Your friend suggests that you simply rescale the y-axis in order to better observe how the exponential function changes over a larger interval. What will happen if you do this? (b) Sketch exp and then sketch 555 exp. How do these functions differ

Step by Step Solution

There are 3 Steps involved in it

1 Expert Approved Answer
Step: 1 Unlock blur-text-image
Question Has Been Solved by an Expert!

Get step-by-step solutions from verified subject matter experts

Step: 2 Unlock
Step: 3 Unlock

Students Have Also Explored These Related Mathematics Questions!