

Question: Graph Input Tool 30 15 27 MC 24 Quantity (Millions of soccer balls) Expected MB (Dollars per soccer ball) 15 15 Expected MC (Dollars per
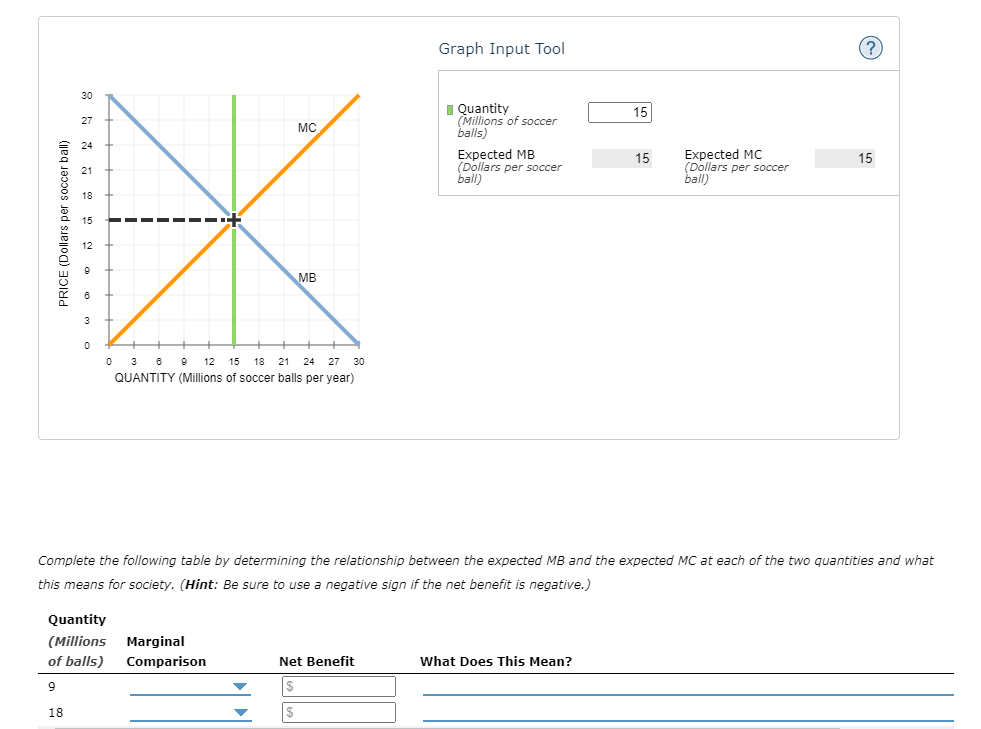
Graph Input Tool 30 15 27 MC 24 Quantity (Millions of soccer balls) Expected MB (Dollars per soccer ball) 15 15 Expected MC (Dollars per soccer ball) 21 18 PRICE (Dollars per soccer ball) 12 MB 0 3 9 12 15 18 21 24 27 30 QUANTITY (Millions of soccer balls per year) Complete the following table by determining the relationship between the expected MB and the expected MC at each of the two quantities and what this means for society. (Hint: Be sure to use a negative sign if the net benefit is negative.) Quantity (Millions of balls) Marginal Comparison Net Benefit What Does This Mean? 9 18
Step by Step Solution
There are 3 Steps involved in it
1 Expert Approved Answer
Step: 1 Unlock

Question Has Been Solved by an Expert!
Get step-by-step solutions from verified subject matter experts
Step: 2 Unlock
Step: 3 Unlock