

Question: Graph it and find the sgraph Part III (5) Complete the Part 111 Table using the experimental data and calculations. PART III TABLE (6) Calculate
Graph it and find the sgraph
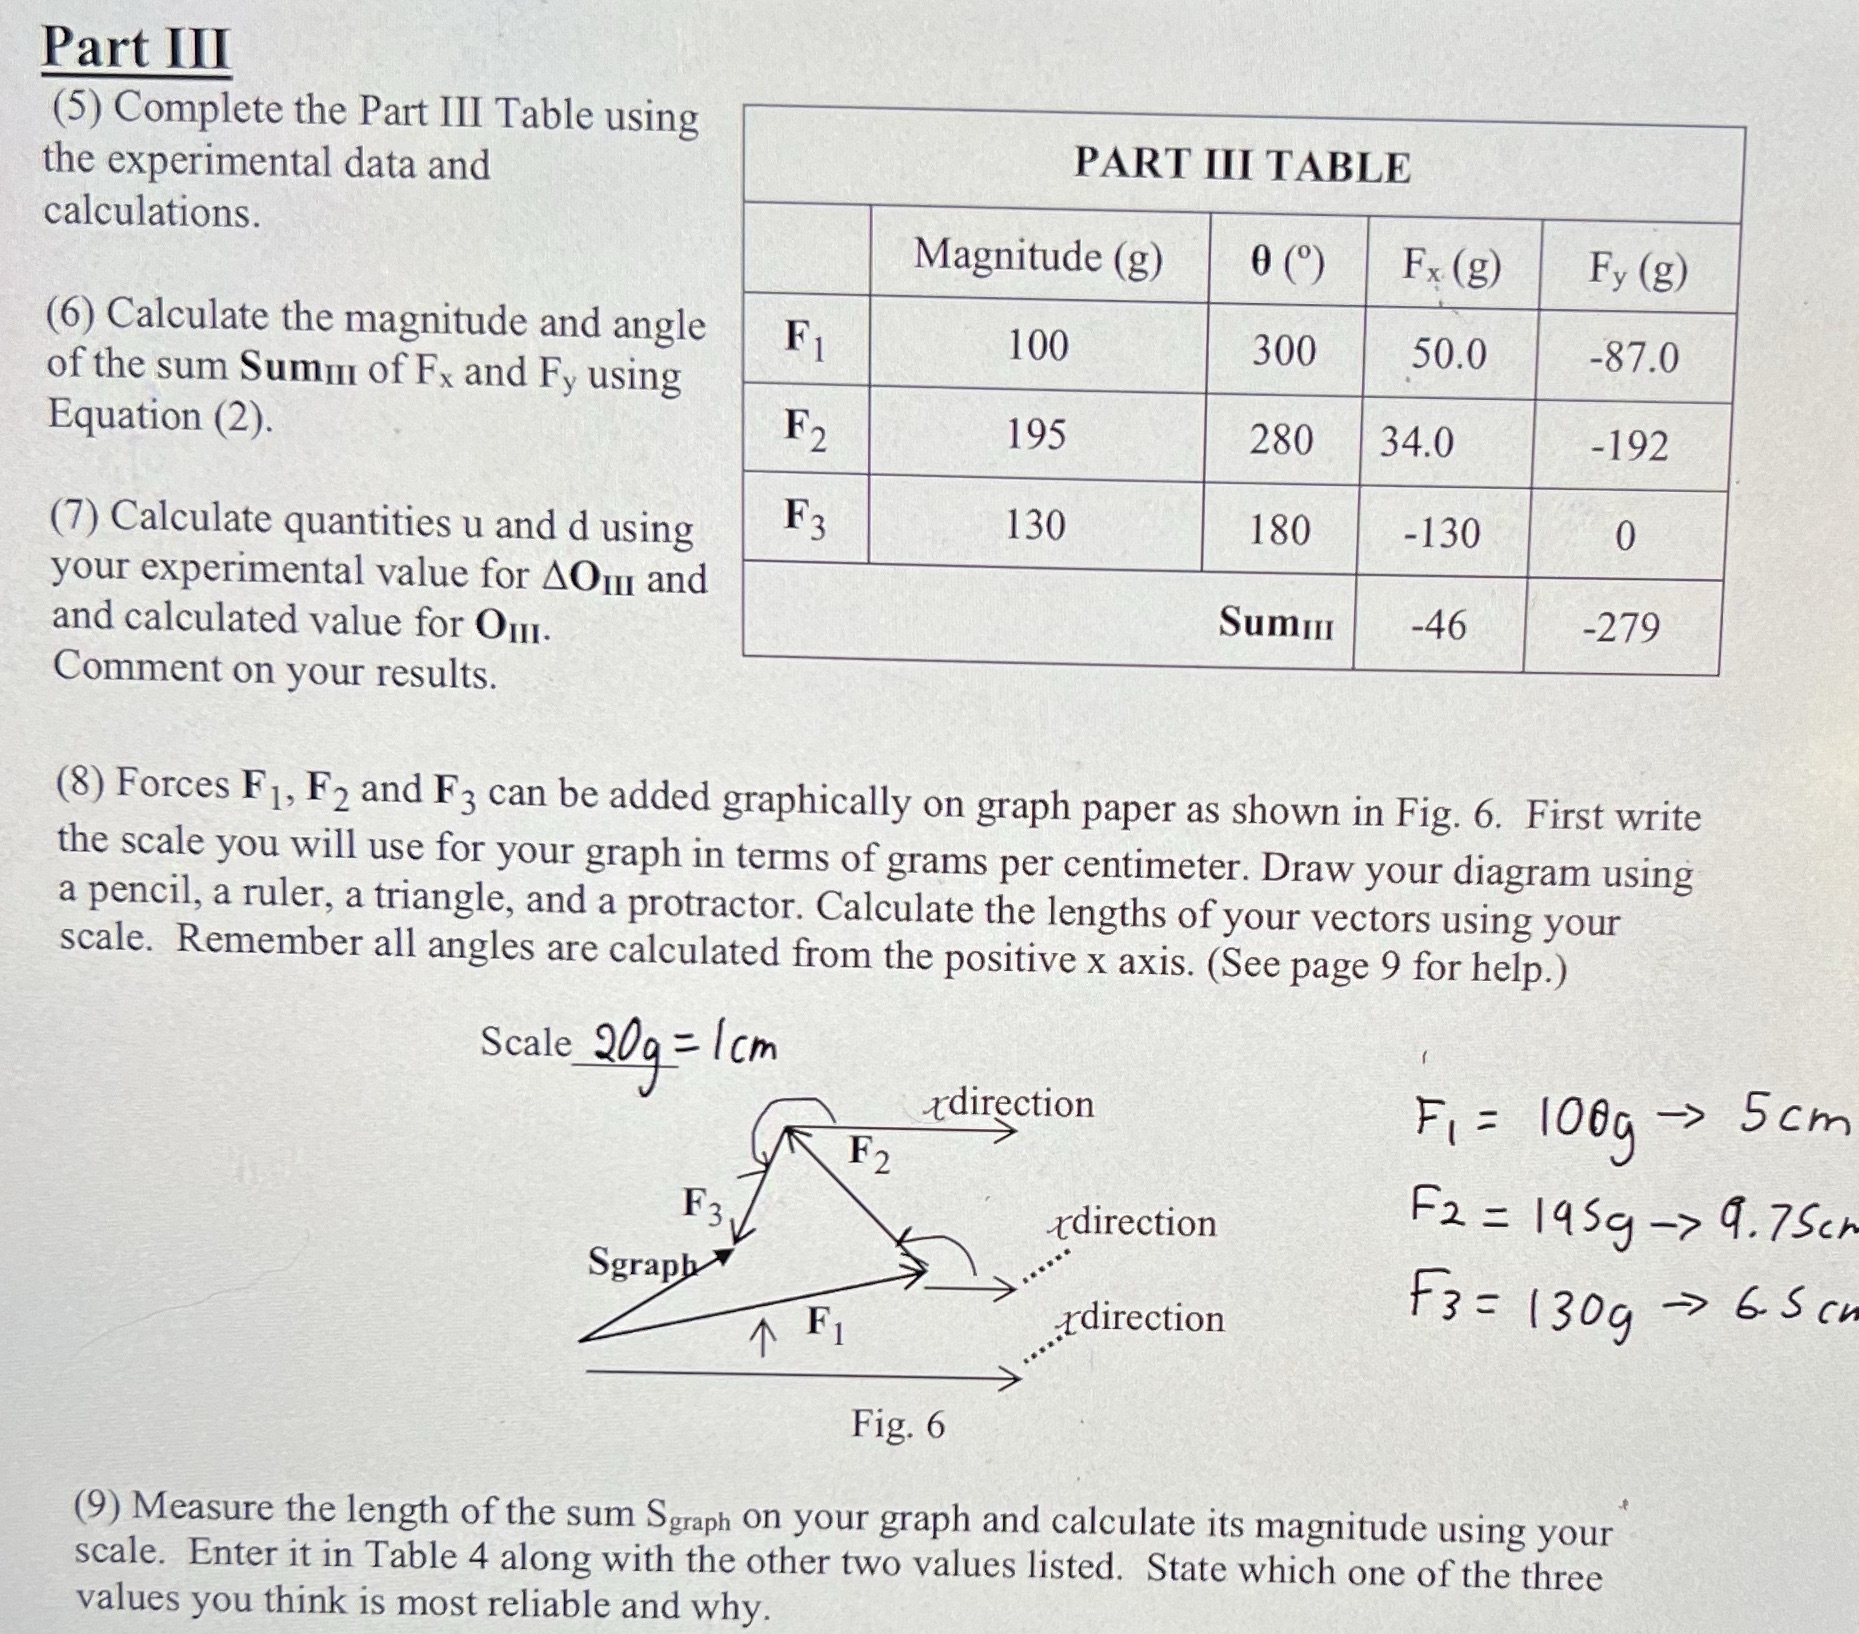
Part III (5) Complete the Part 111 Table using the experimental data and calculations. PART III TABLE (6) Calculate the magnitude and angle of the sum Sumin of Fx and Fy using Equation (2). (7) Calculate quantities u and d using your experimental value for A011: and and calculated value for Our. Comment on your results. (8) Forces F1, F2 and F3 can be added graphically on graph paper as shown in Fig. 6. First write the scale you will use for your graph in terms of grams per centimeter. Draw your diagram using a pencil, a ruler, a triangle, and a protractor. Calculate the lengths of your vectors using your scale. Remember all angles are calculated from the positive x axis. (See page 9 for help.) Scale 309 7 icrn ' {direction pl 2 [053 > San {direction Fl 2 I'ng > '7. 750 4' F1 :::{direction F3" 3 (309 '7 5 5 0' Fig. 6 (9) Measure the length of the sum ngph on your graph and calculate its magnitude using your. scale. Enter it in Table 4 along with the other two values listed. State which one of the three values you think is most reliable and why
Step by Step Solution
There are 3 Steps involved in it

Get step-by-step solutions from verified subject matter experts