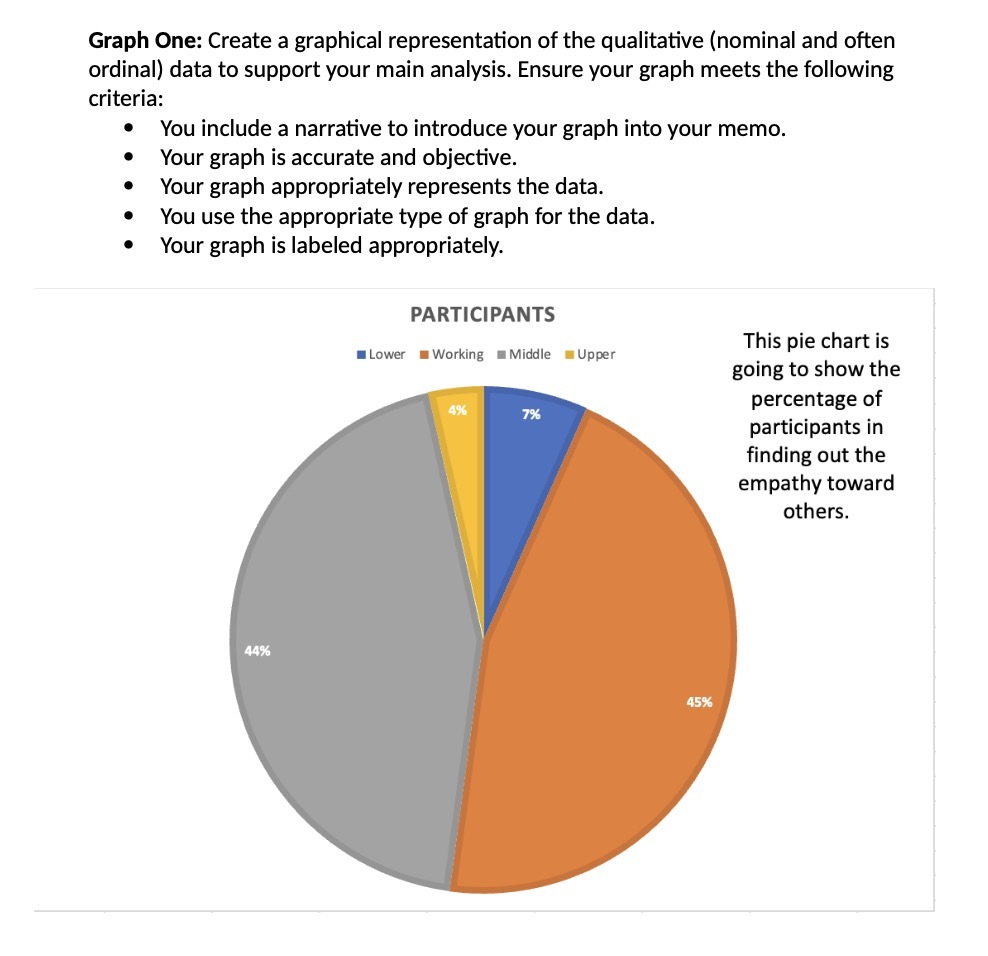
Question: Graph One: Create a graphical representation of the qualitative (nominal and often ordinal) data to support your main analysis. Ensure your graph meets the following

Graph One: Create a graphical representation of
Graph One: Create a graphical representation of the qualitative (nominal and often ordinal) data to support your main analysis. Ensure your graph meets the following criteria: You include a narrative to introduce your graph into your memo. Your graph is accurate and objective. . . Your graph appropriately represents the data. You use the appropriate type of graph for the data. . Your graph is labeled appropriately. PARTICIPANTS This pie chart is Lower Working Middle Upper going to show the 4% percentage of 7% participants in finding out the empathy toward others. 44% 45%

Step by Step Solution

There are 3 Steps involved in it

1 Expert Approved Answer
Step: 1 Unlock blur-text-image
Question Has Been Solved by an Expert!

Get step-by-step solutions from verified subject matter experts

Step: 2 Unlock
Step: 3 Unlock

Students Have Also Explored These Related Mathematics Questions!