

Question: Graph represent #6 Question Help The following graph represents the results of a survey, in which a random sample of adults was asked if they
Graph represent #6
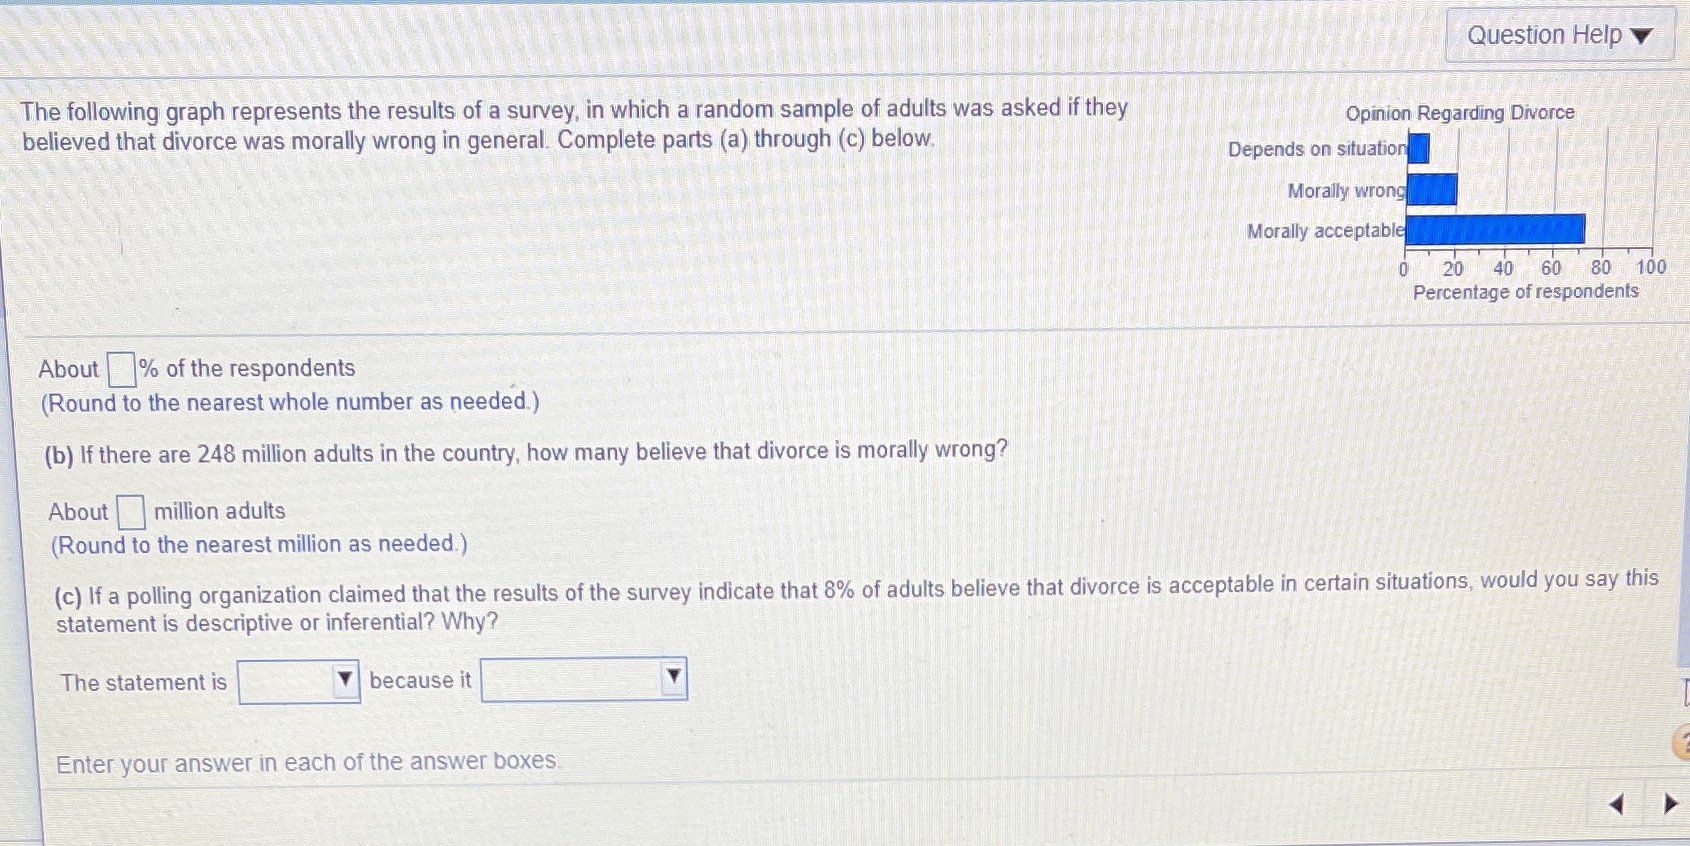
Question Help The following graph represents the results of a survey, in which a random sample of adults was asked if they Opinion Regarding Divorce believed that divorce was morally wrong in general. Complete parts (a) through (c) below. Depends on situation Morally wrong Morally acceptable 0 20 40 60 80 100 Percentage of respondents About % of the respondents (Round to the nearest whole number as needed.) (b) If there are 248 million adults in the country, how many believe that divorce is morally wrong? About million adults (Round to the nearest million as needed.) (c) If a polling organization claimed that the results of the survey indicate that 8% of adults believe that divorce is acceptable in certain situations, would you say this statement is descriptive or inferential? Why? The statement is because it Enter your answer in each of the answer boxes
Step by Step Solution
There are 3 Steps involved in it

Get step-by-step solutions from verified subject matter experts