

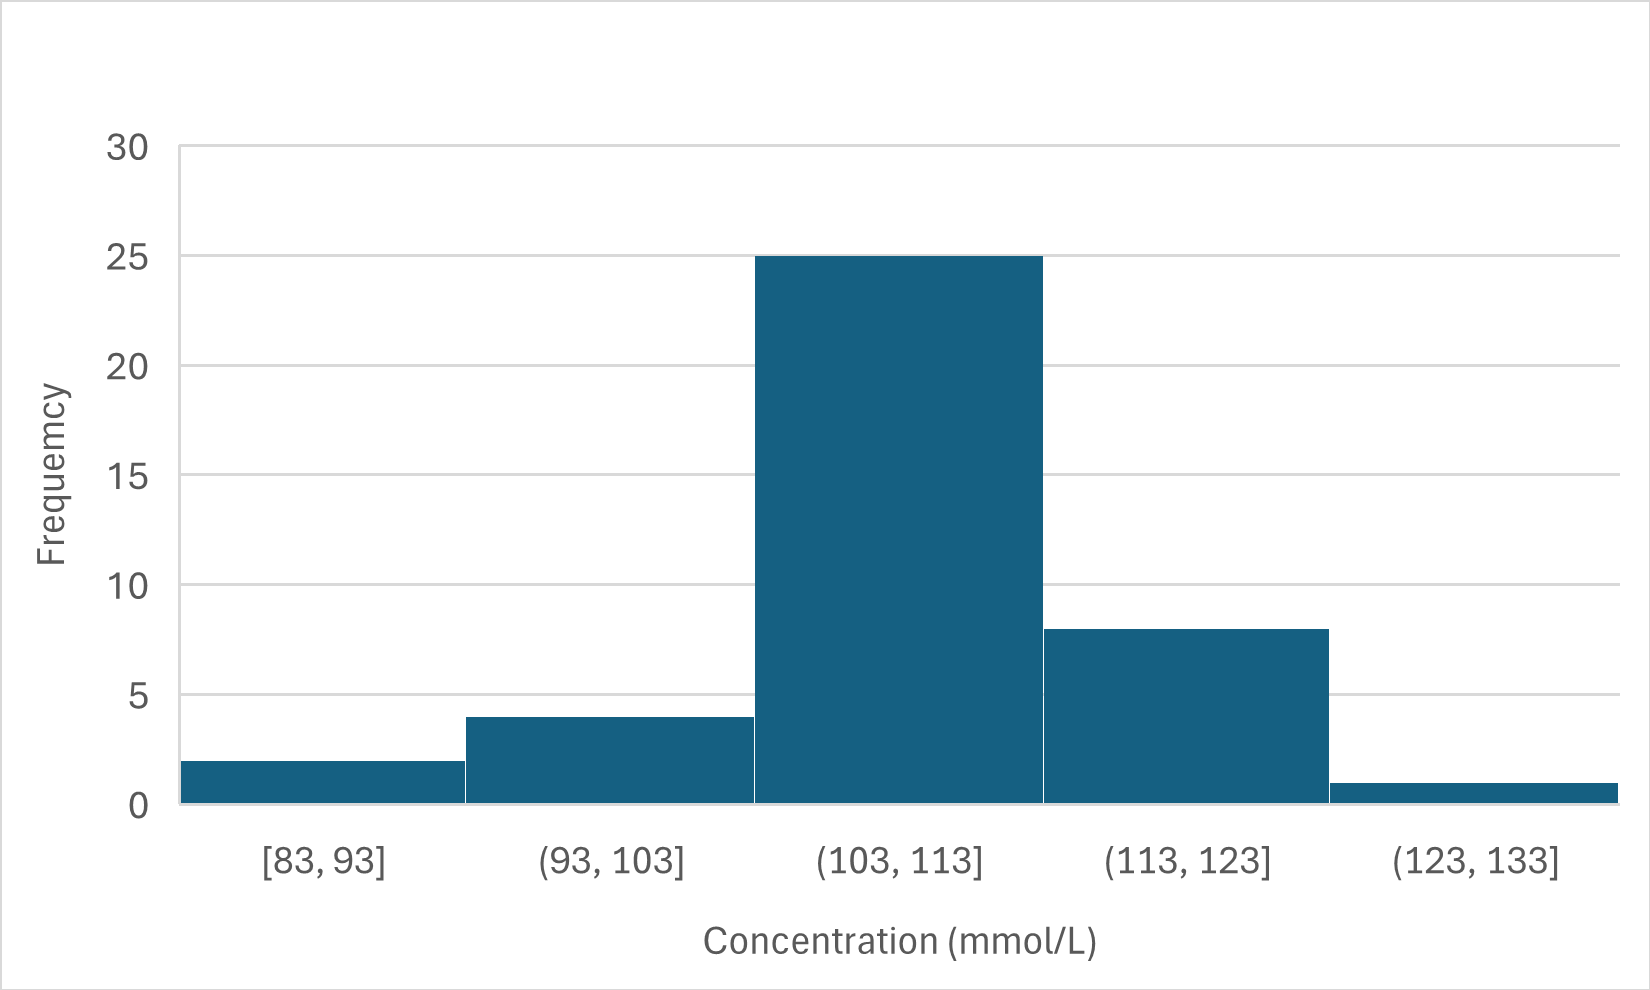
Question: Graph the above data (frequency against values (concentration)) (1.5 mark) ii. Establish the distribution of the data (parametric or non-parametric) just by visualising the graph
Graph the above data (frequency against values (concentration)) (1.5 mark) ii. Establish the distribution of the data (parametric or non-parametric) just by visualising the graph (question i). Explain your reasoning. (1.5 mark) iii. Calculate the reference interval from this data using an appropriate method based on data distribution. Show all the steps of calculation and explain the steps where possible/appropriate. (3 marks
Step by Step Solution
There are 3 Steps involved in it
1 Expert Approved Answer
Step: 1 Unlock

Question Has Been Solved by an Expert!
Get step-by-step solutions from verified subject matter experts
Step: 2 Unlock
Step: 3 Unlock