

Question: Graph the DataIn this lab, Position is the dependent variable, so should go onthe y-axis and Time, as theindependent variable goes on the x-axis. Part
 Graph the DataIn this lab, "Position" is the dependent variable, so should go onthe y-axis and "Time", as theindependent variable goes on the x-axis.
Part IIIn part I, you started the car at the reference point. If your caris at this point, then its positionis zero and every other position is measured from this point. InPart II, you will start your carsomewhere that is not at the reference point. So your initialposition will not be 0 cm, but somedistance away from it. Then the car either moves further away orcloser to the reference point.1. Set up the lab as you did in Part I.2. Start the car moving on the positive side of the reference point(either direction) andimmediately start the time on the stopwatch. Note that anymeasurements taken on thisside of the reference point will be recorded as a positivedisplacement, while anymeasurements on the other side will be recorded as a negativedisplacement.3. As the timer reads the time aloud, the marker will mark theposition of the car on the floorwith tape. Take at least 6 data points.4. Measure the displacement of all the marks from the referencepoint and record the datain data table.5. Repeat starting the car on the negative side of the referencepoint (moving in eitherdirection).Record data in an organized, labelled manner:Average?xAverage?x Time(s)Change in Position (cm) Change in Position (cm)12345678Graph data with change in position on the y-axis and time on thex-axis
Two posts are required to complete this lab discussion.Post I is your initial conclusion based on the data obtained inyour experiment. It shouldbe written in complete sentences.*Post one Position Time graph with a line from all three parts ofthe Constant Velocity LabPart I and Part II. (So one graph with three lines.)*Post one Velocity Time graph with a line from all threeversions.
How will the graph look like for position vs time graph (onegraph with 3 lines) and Velocity Time graph with a line from allthree versions.
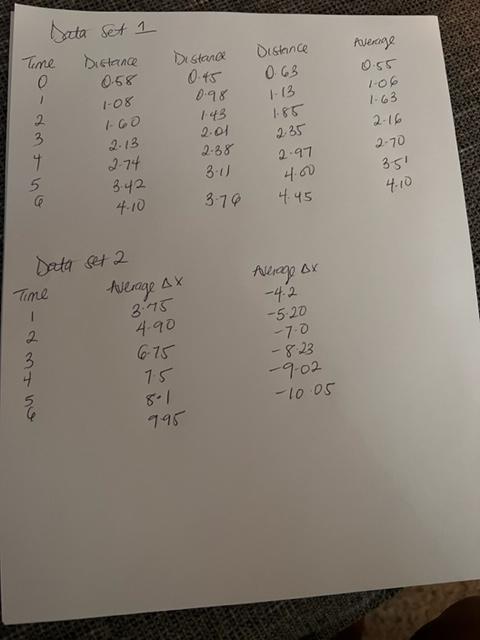
Time 0 1 2 - 6 3 4 5 G Time -d3 + nu Data Set 1 Distance 058 Data Set 2 Average AX 3.75 4.90 2 4 1-08 1-60 2-13 2-74 3.42 4-10 Distance 0.45 6-75 75 8-1 995 0.98 1.43 2.01 2-38 3-11 376 Distance 0.63 1-13 1.85 2.35 2-97 4.60 4.45 Average BX -4.2 -5-20 -7.0 -8.23 -9-02 -10:05 Average . 1-06 1-63 2-16 2-70 3-51 4.10
Step by Step Solution
3.33 Rating (162 Votes )
There are 3 Steps involved in it
Position vs Time Graph The position vs time graph represents the displacement of the car over time E... View full answer

Get step-by-step solutions from verified subject matter experts