

Question: Graph the equation y= 60x + 6000 using x-coordinates 0, 25, and 50. 1. Use the line tool (y= 60x + 6000, plot 3
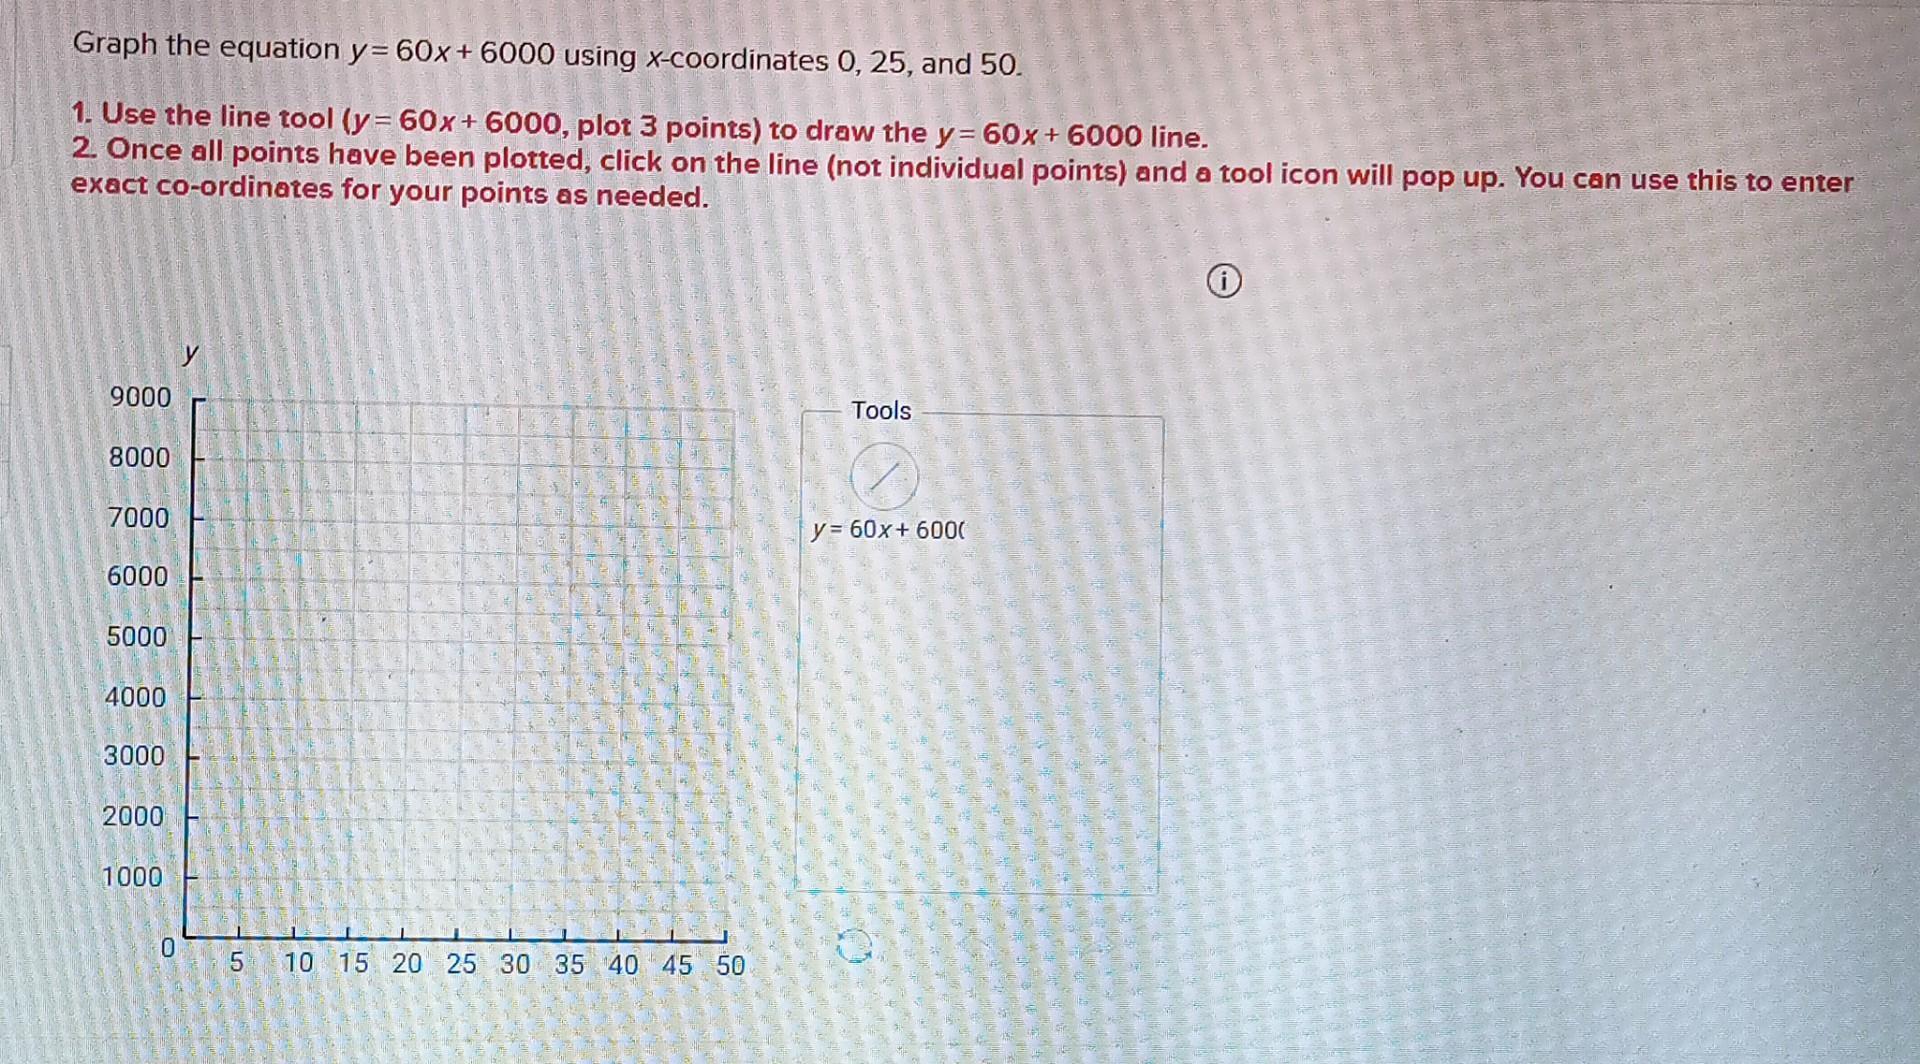
Graph the equation y= 60x + 6000 using x-coordinates 0, 25, and 50. 1. Use the line tool (y= 60x + 6000, plot 3 points) to draw the y= 60x + 6000 line. 2. Once all points have been plotted, click on the line (not individual points) and a tool icon will pop up. You can use this to enter exact co-ordinates for your points as needed. 9000 8000 7000 6000 5000 4000 3000 2000 1000 0 5 10 15 20 25 30 35 40 45 50 Tools y= 60x+6000 Th 40 * * O
Step by Step Solution
3.41 Rating (167 Votes )
There are 3 Steps involved in it
Equation of line is y 60x 6000 Xcoordinates are 0 25 50 For ... View full answer

Get step-by-step solutions from verified subject matter experts