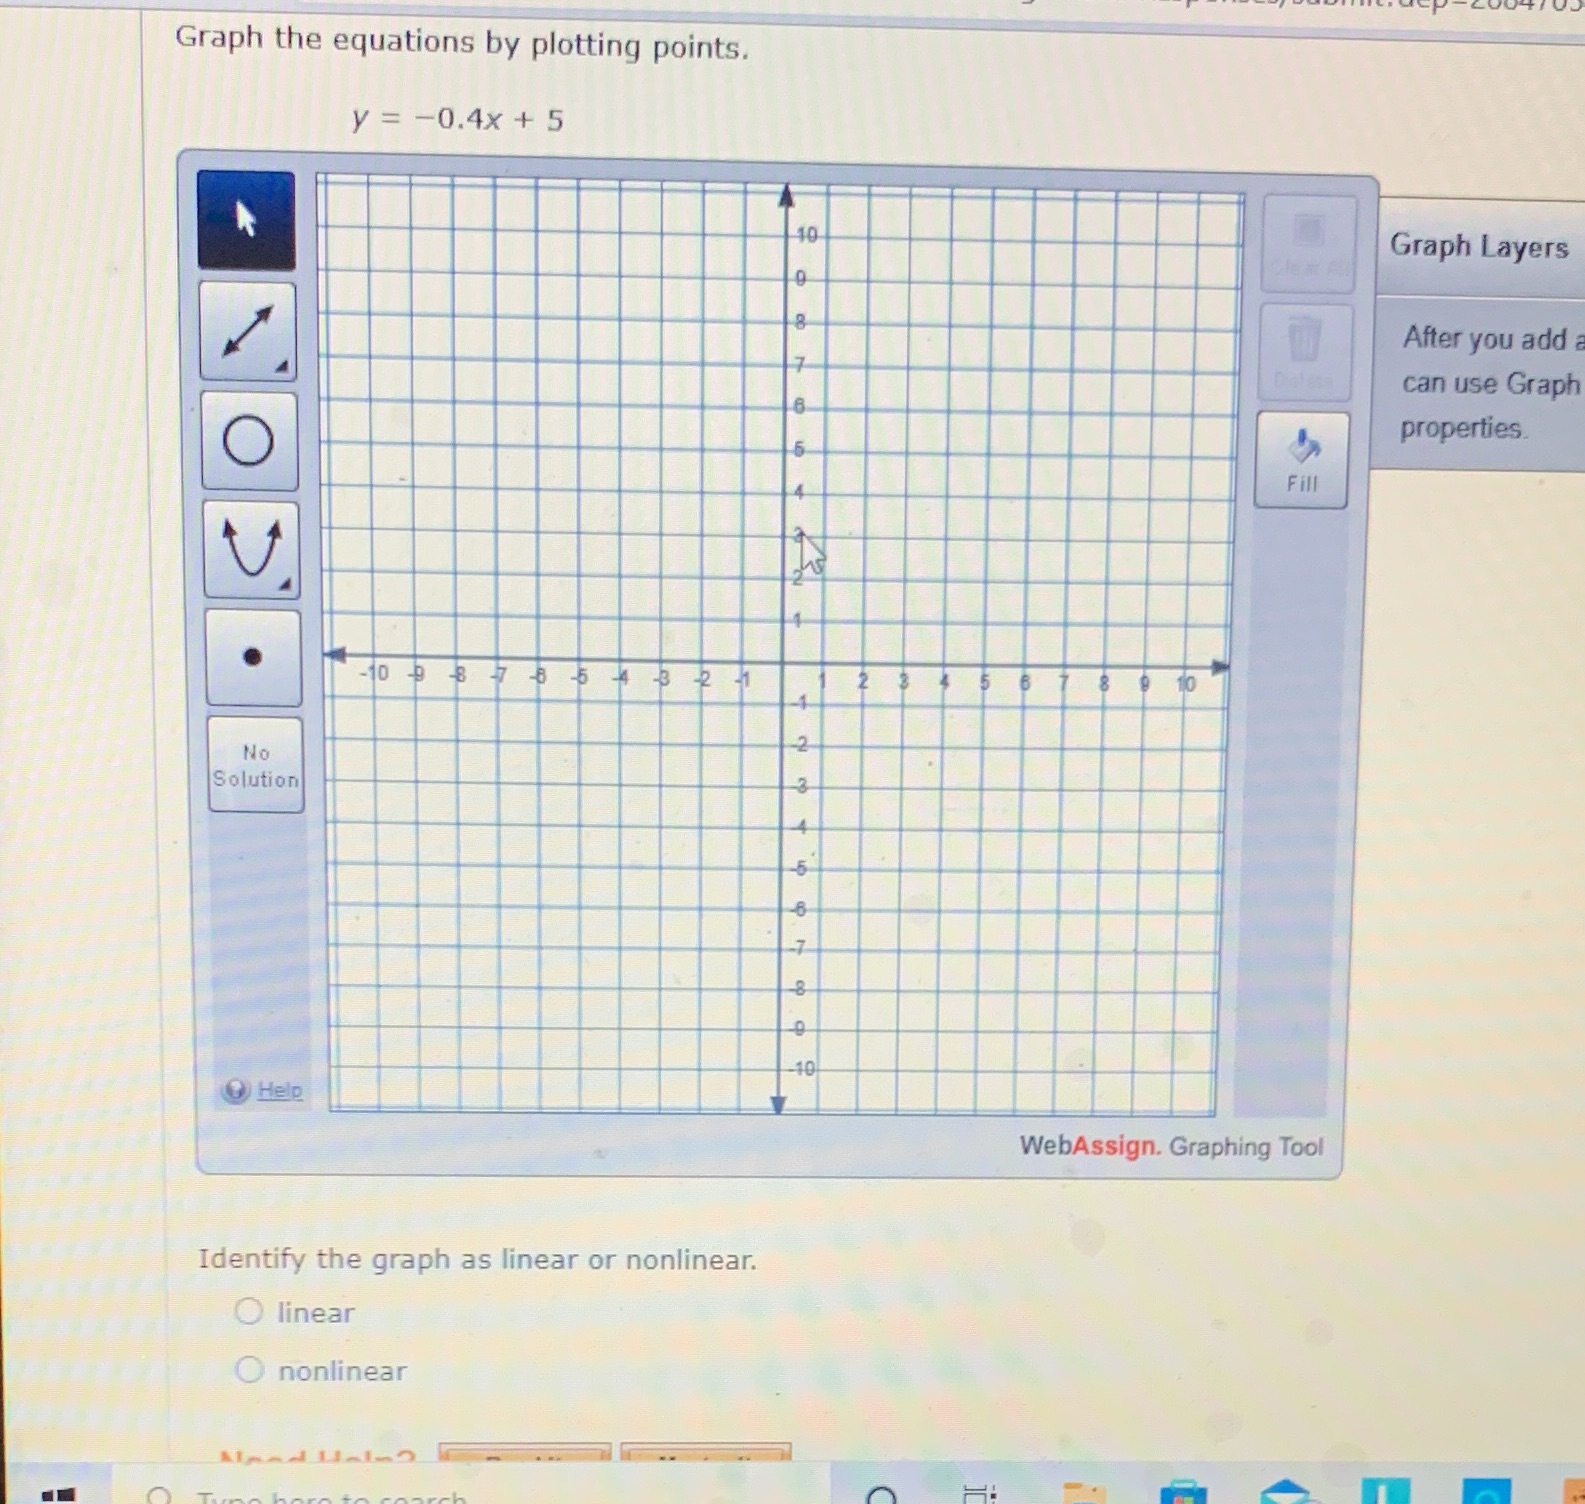
Question: Graph the equations by plotting points. y = -0.4x + 5 40 Graph Layers After you add can use Graph O properties. Fill -10 3

Graph the equations by plotting points. y = -0.4x
Graph the equations by plotting points. y = -0.4x + 5 40 Graph Layers After you add can use Graph O properties. Fill -10 3 3 7 6 5 4 3 2 - 2 3 4 5 6 89 10 No Solution Help WebAssign. Graphing Tool Identify the graph as linear or nonlinear. O linear O nonlinear

Step by Step Solution

There are 3 Steps involved in it

1 Expert Approved Answer
Step: 1 Unlock blur-text-image
Question Has Been Solved by an Expert!

Get step-by-step solutions from verified subject matter experts

Step: 2 Unlock
Step: 3 Unlock

Students Have Also Explored These Related Mathematics Questions!