

Question: Graph the following aggregate demand (AD) and aggregate supply (AS) curves The following schedule provides information with which to draw both an AD and
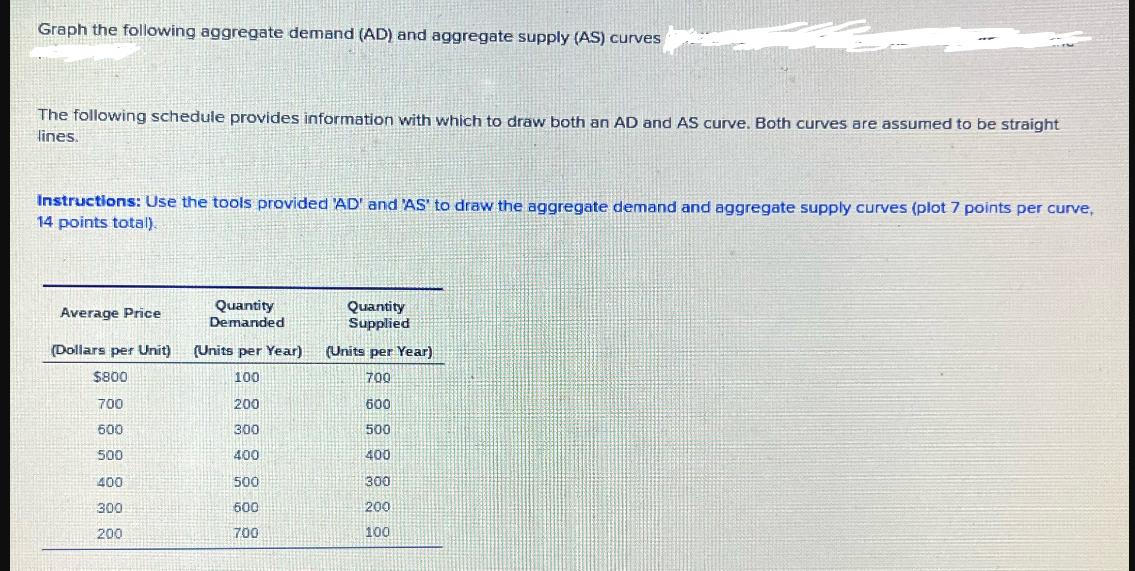
Graph the following aggregate demand (AD) and aggregate supply (AS) curves The following schedule provides information with which to draw both an AD and AS curve. Both curves are assumed to be straight lines. Instructions: Use the tools provided 'AD' and 'AS' to draw the aggregate demand and aggregate supply curves (plot 7 points per curve, 14 points total). Average Price (Dollars per Unit) $800 700 600 500 400 300 200 Quantity Demanded (Units per Year) 100 200 300 400 500 600 700 Quantity Supplied (Units per Year) 700 600 500 400 300 200 100
Step by Step Solution
There are 3 Steps involved in it
Answer Below is the graph Quantity Un... View full answer

Get step-by-step solutions from verified subject matter experts