

Question: Graph the function. f (x) = sin (xx Use the Sine tool. First plot a point on the midline of the function. Then plot either
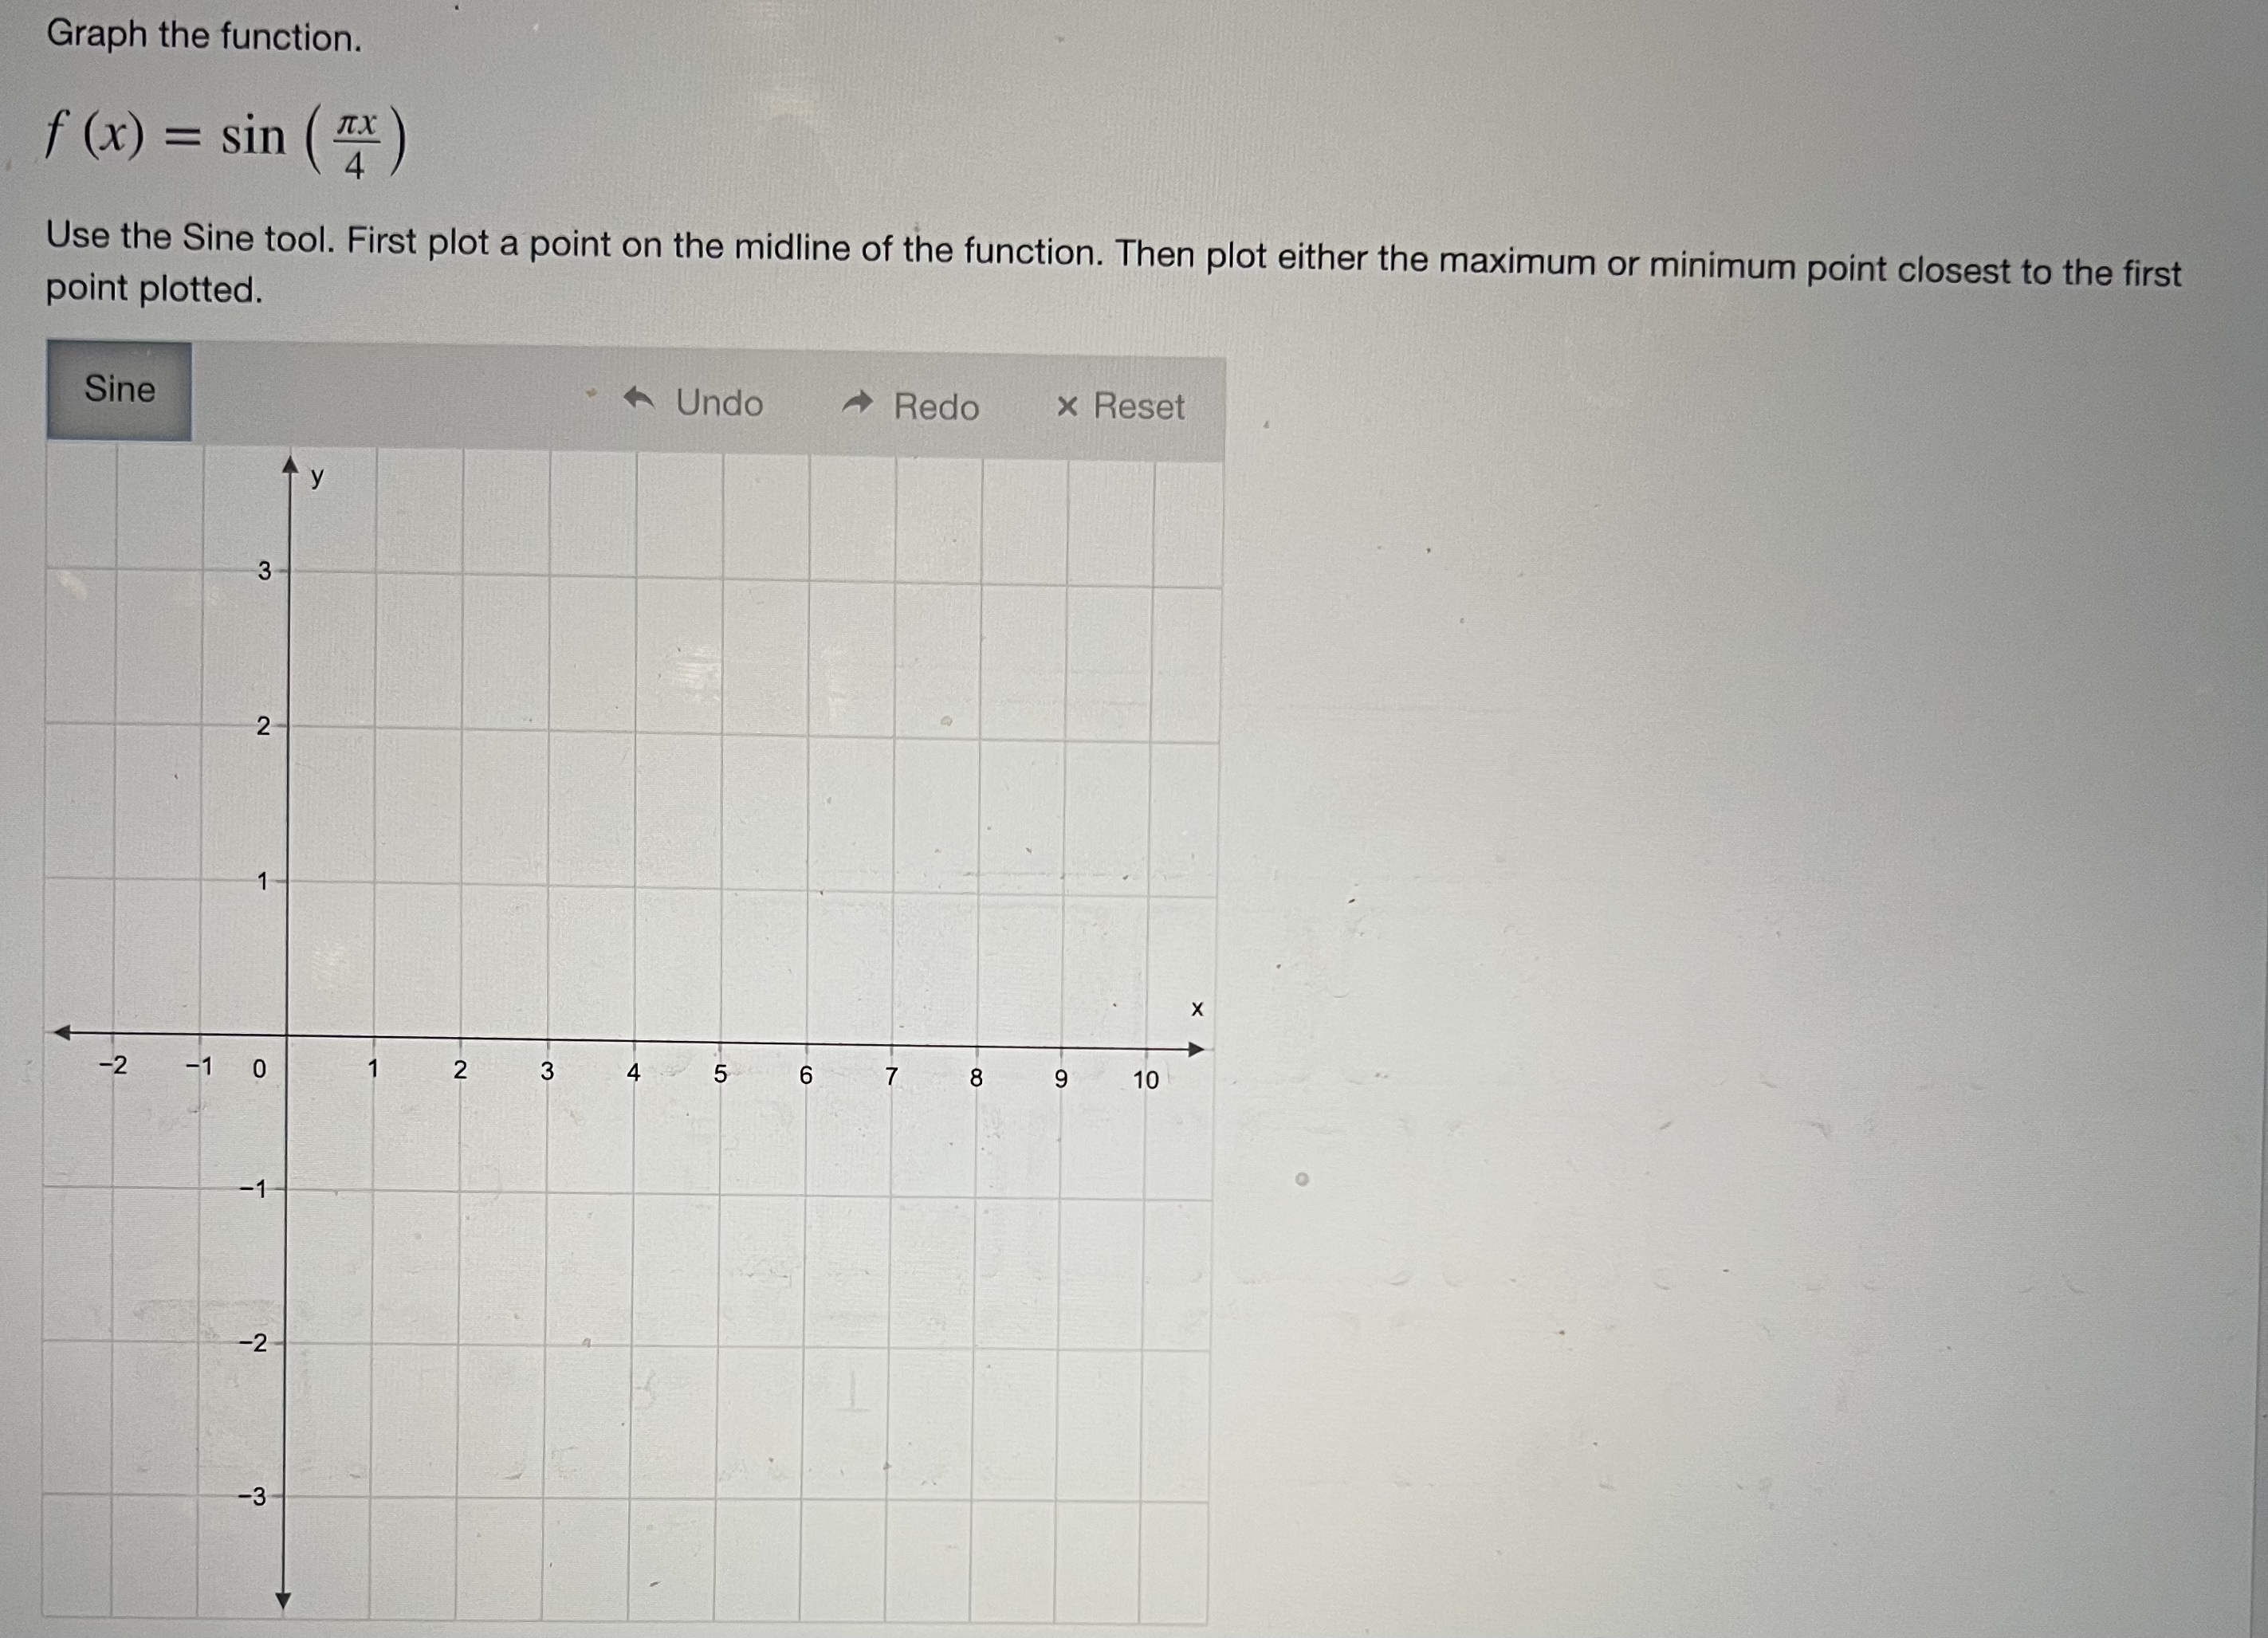


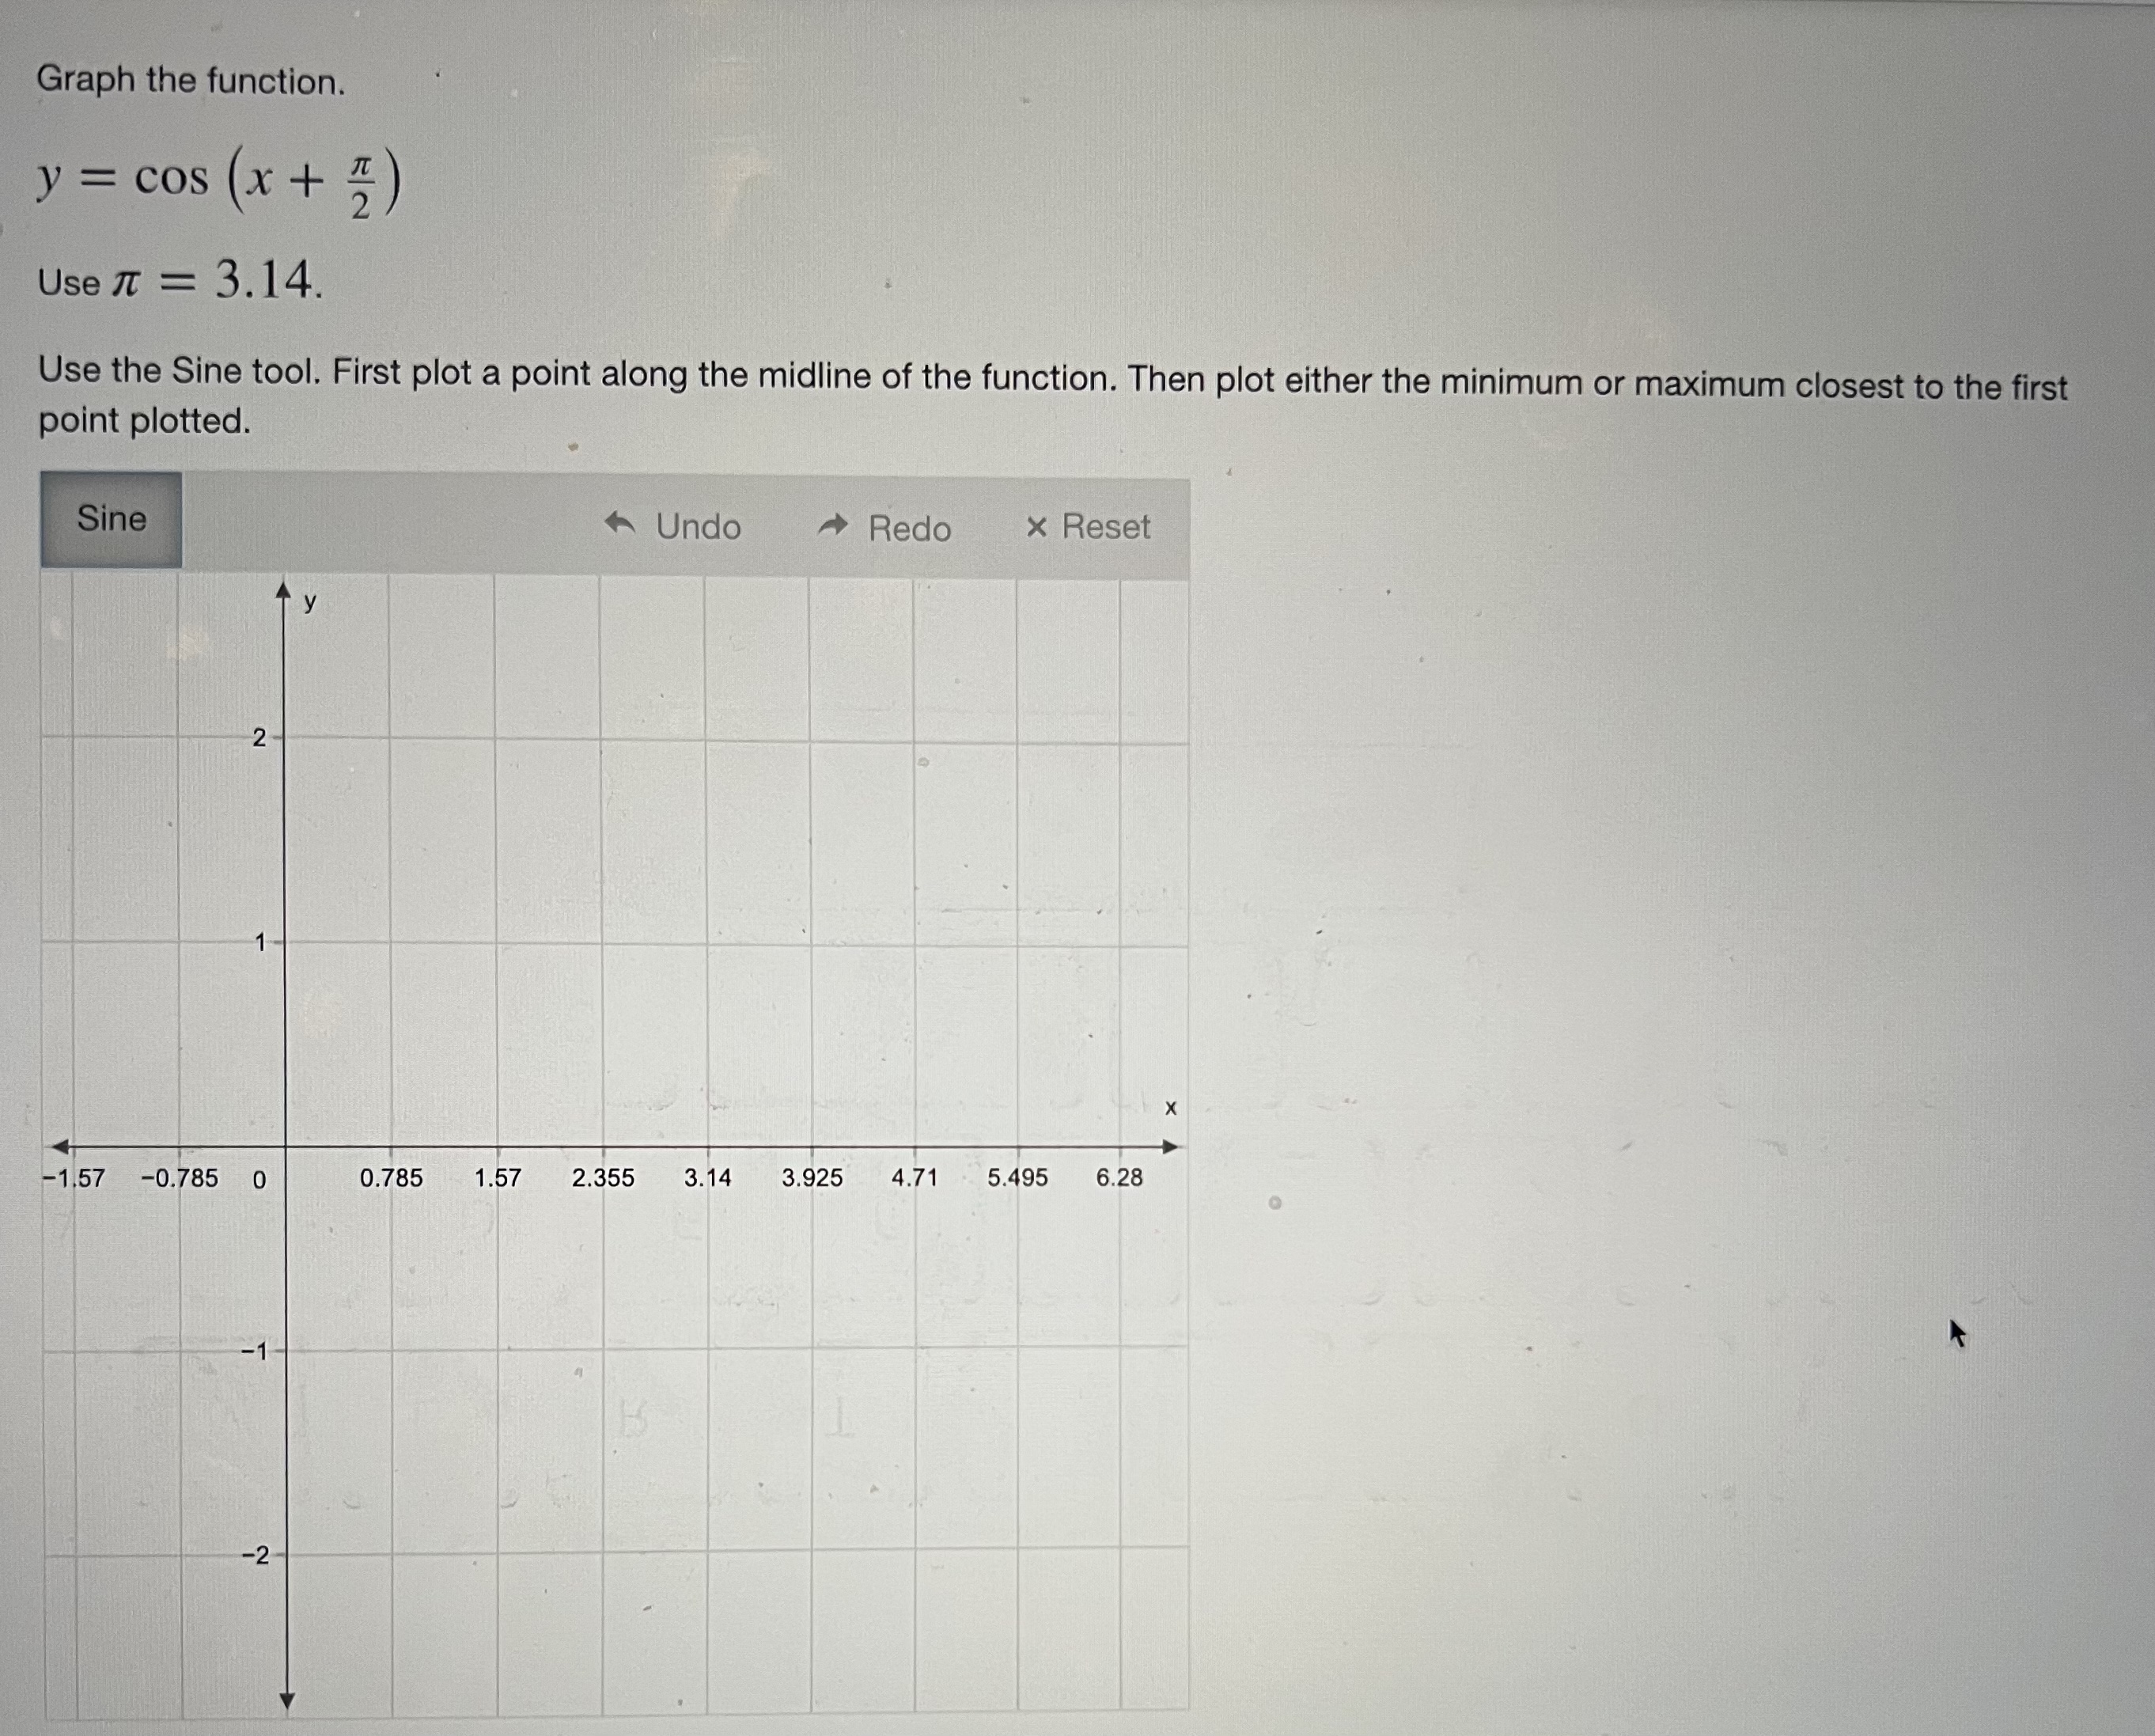
Graph the function. f (x) = sin (xx Use the Sine tool. First plot a point on the midline of the function. Then plot either the maximum or minimum point closest to the first point plotted. Sine Undo Redo x Reset 3 2 -2 -1 0 2 3 4 5 6 8 9 10 -1 -2 -3Graph the function. y = cos (x+ Use It = 3.14. Use the Sine tool. First plot a point along the midline of the function. Then plot either the minimum or maximum closest to the first point plotted. Sine Undo Redo x Reset -1.57 -0.785 0 0.785 1.57 2.355 3.14 3.925 4.71 5.495 6.28 -1 -2
Step by Step Solution
There are 3 Steps involved in it
1 Expert Approved Answer
Step: 1 Unlock

Question Has Been Solved by an Expert!
Get step-by-step solutions from verified subject matter experts
Step: 2 Unlock
Step: 3 Unlock