

Question: Graph the function f(x) =x3+3xz-9x + 1. Use the chart as a guideline for the required characteristics. Do not find the Xintercepts. To receive full
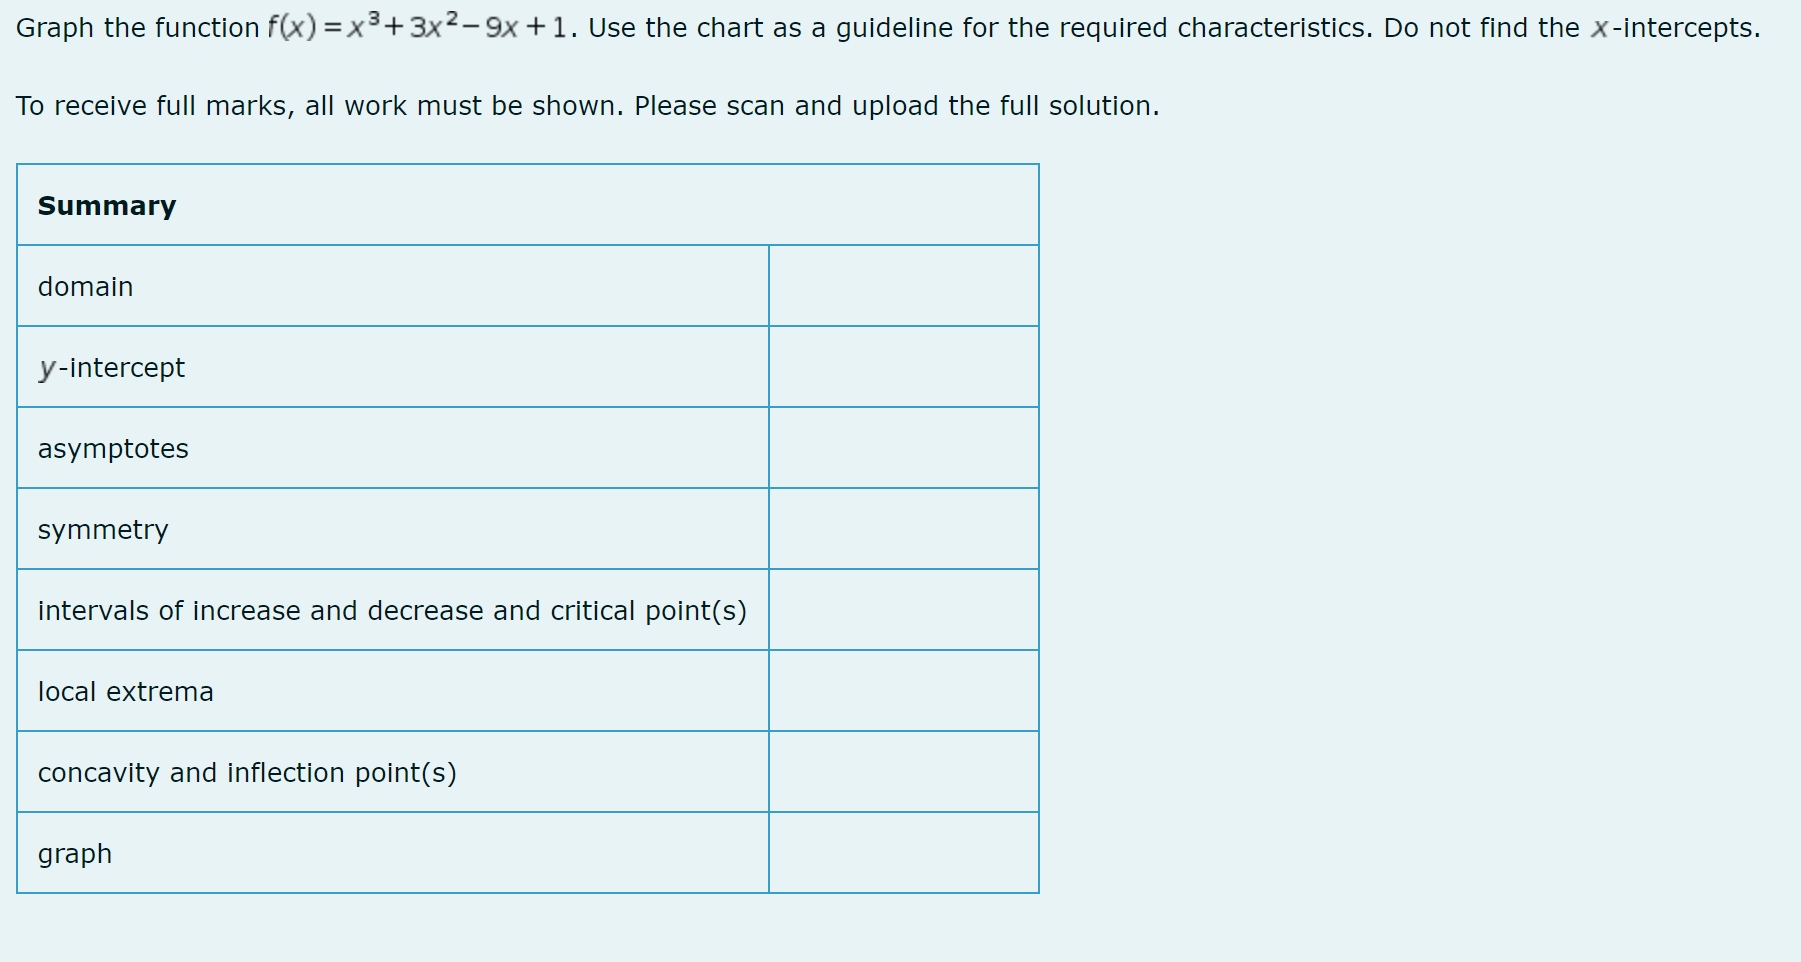
Graph the function f(x) =x3+3xz-9x + 1. Use the chart as a guideline for the required characteristics. Do not find the Xintercepts. To receive full marks, all work must be shown. Please scan and upload the full solution. intervals of Increase and decrease and critical pomt(s) local extrema concavity and inflection pomt(s) graph
Step by Step Solution
There are 3 Steps involved in it
1 Expert Approved Answer
Step: 1 Unlock

Question Has Been Solved by an Expert!
Get step-by-step solutions from verified subject matter experts
Step: 2 Unlock
Step: 3 Unlock