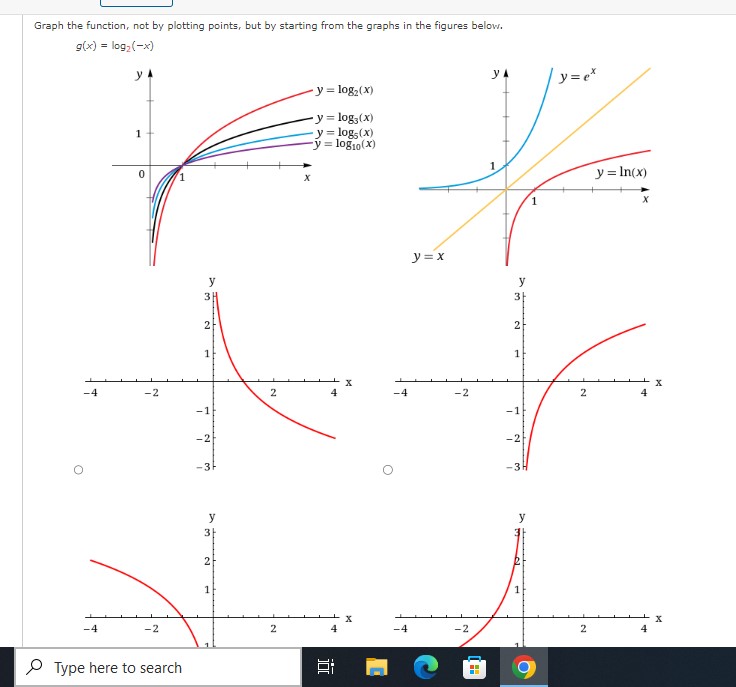
Question: Graph the function, not by plotting points, but by starting from the graphs in the figures below. g(x) = 1092(-x) y A y = log,(x)

Graph the function, not by plotting points, butGraph the function, not by plotting points, but
Graph the function, not by plotting points, but by starting from the graphs in the figures below. g(x) = 1092(-x) y A y = log,(x) y = log; (x) 1 y = log=(x) y = log10(X) y = In(x) y = X X -4 -2 4 -4 -2 2 -1 -21 -2 O -3 O -3 1 -2 2 4 -4 -2 2 4 Type here to searchState the domain and the range. (Enter your answers using interval notation.) domain abuEJ State the asymptote

Step by Step Solution

There are 3 Steps involved in it

1 Expert Approved Answer
Step: 1 Unlock blur-text-image
Question Has Been Solved by an Expert!

Get step-by-step solutions from verified subject matter experts

Step: 2 Unlock
Step: 3 Unlock

Students Have Also Explored These Related Mathematics Questions!