

Question: Graph the function, not by plotting points, but by starting from the graph of y = ex in the figure below. y = e*
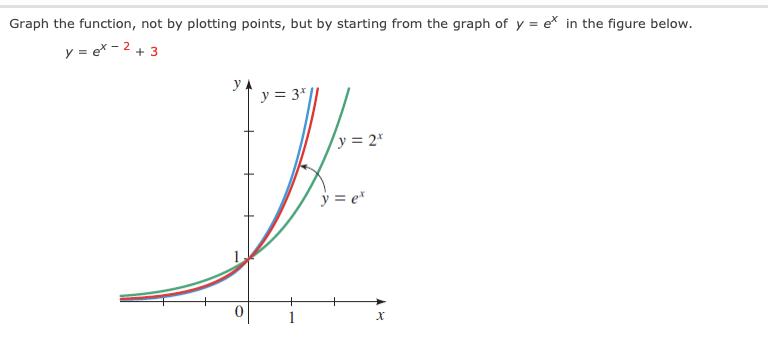

Graph the function, not by plotting points, but by starting from the graph of y = ex in the figure below. y = e* - 2 + 3 y=3*] y = 2* y=ex x State the domain and range. (Enter your answers using interval notation.) domain range State the asymptote.
Step by Step Solution
There are 3 Steps involved in it
1 Expert Approved Answer
Step: 1 Unlock

Question Has Been Solved by an Expert!
Get step-by-step solutions from verified subject matter experts
Step: 2 Unlock
Step: 3 Unlock