

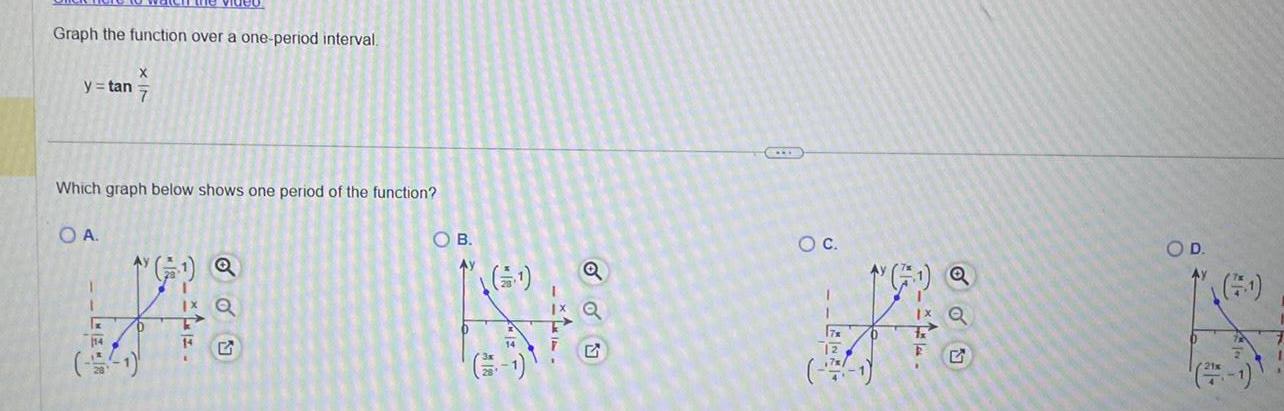
Question: Graph the function over a one-period interval. y = tan 7 Which graph below shows one period of the function? OA. G OB. (1)
Graph the function over a one-period interval. y = tan 7 Which graph below shows one period of the function? OA. G OB. (1) Q E O C. +3 OD.
Step by Step Solution
There are 3 Steps involved in it
1 Expert Approved Answer
Step: 1 Unlock

Question Has Been Solved by an Expert!
Get step-by-step solutions from verified subject matter experts
Step: 2 Unlock
Step: 3 Unlock