

Question: Graph the given data below and follow the instructions. Graph the given table below and explain how the Law of Demand works. Price per Unit
Graph the given data below and follow the instructions.
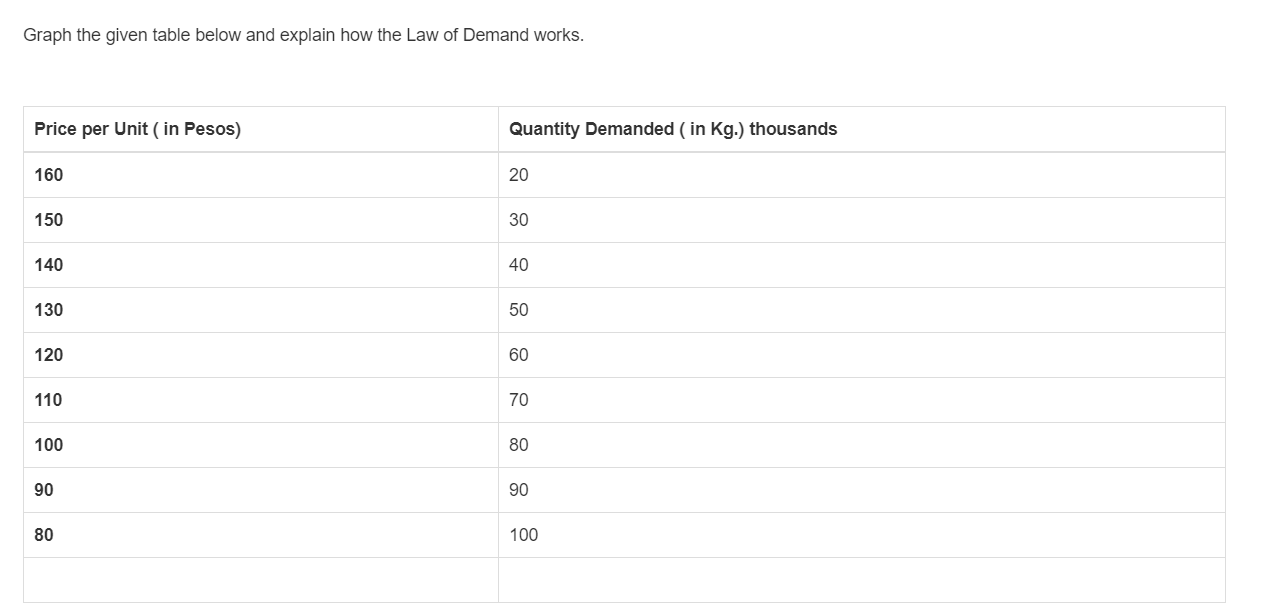
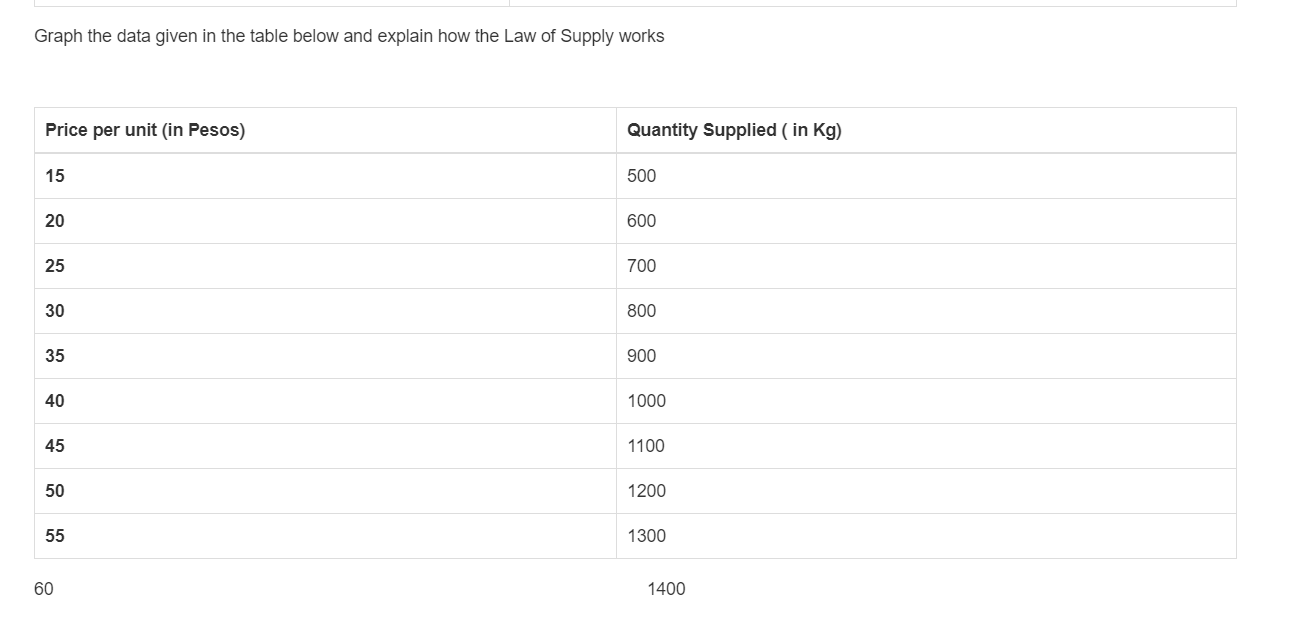
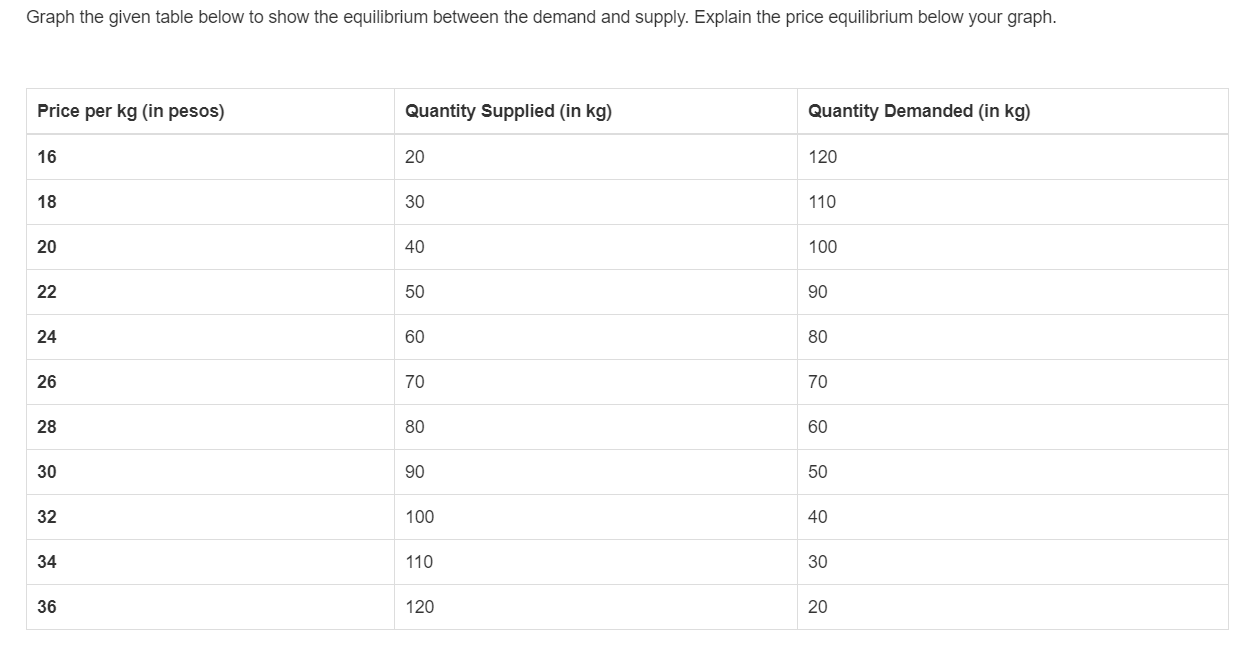
Graph the given table below and explain how the Law of Demand works. Price per Unit ( in Pesos) Quantity Demanded ( in Kg.) thousands 1 60 20 1 50 30 140 40 1 30 50 120 50 110 70 1 00 30 90 90 80 100 Graph the data given in the table below and explain how the Law of Supply works Price per unit (in Pesos) Quantity Supplied ( in Kg) 1 5 500 20 600 25 700 30 300 35 900 40 1000 45 1100 50 1200 55 1300 50 1400 Graph the given table below to show the equilibrium between the demand and supply. Explain the price equilibrium below your graph. Price per kg (in pesos) Quantity Supplied (in kg) Quantity Demanded (in kg) 16 20 120 18 30 110 20 40 100 22 50 90 24 60 80 26 70 70 28 80 60 30 90 50 32 100 40 34 110 30 36 120 20
Step by Step Solution
There are 3 Steps involved in it

Get step-by-step solutions from verified subject matter experts